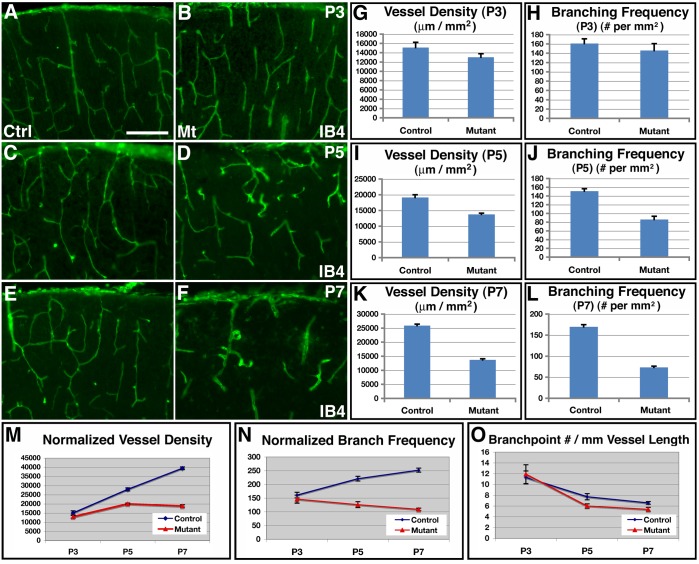
Figure 6. Defective vessel development following reduced astrogliogenesis in class II orc3/hGFAP-cre mutant cortices.
(A–F) Vessel morphology, as revealed by IB4 staining, in control (A, C & E) and mutant (B, D & F) cortices at P3 (A & B), P5 (C & D), and P7 (E & F). No obvious differences in vessel development were observed between controls and mutants at P3. Areas with reduced vessel density were frequently observed in mutants at P5. Obvious defects in vessel development were observed in mutants at P7. (G–L) Quantification of vessel density and branch point frequency in control and mutant cortices at P3 (G & H), P5 (I & J), and P7 (K & L). Statistical analysis by Student' t test showed that there were no significant differences in either vessel density (control, 15109±1139 μm/mm2; mutant 13027±753 μm/mm2; P = 0.14, n = 9) or branch point frequency (control, 160.9±10.2/mm2; mutant 146.0±14.6/mm2; P = 0.42, n = 9) at P3, but significant reductions in both at P5 (vessel density: control, 19134±849 μm/mm2; mutant 13754±408 μm/mm2; P = 1.7×10⁻⁵, n = 14; branching frequency: control, 151.0±5.7/mm2; mutant 86.2±7.4/mm2; P = 4.8×10⁻⁶, n = 9), as well as at P7 (vessel density: control, 25909±487 μm/mm2; mutant 13704±402 μm/mm2; P = 1.8×10⁻⁶, n = 4; branching frequency: control, 169.8±4.9/mm2; mutant 73.2±3.1/mm2; P = 1.4×10⁻⁵, n = 4). (M–O) Quantitative analysis of normalized vessel growth and branching from P3 to P7 in control and mutant cortices. Vessel density and branching frequency were normalized against cortical area expansion (M &N). Branching frequency was normalized against total vessel length (O). In control brains, normalized vessel density significantly increased during the periods both from P3 to P5 (P = 9.5×10⁻⁸, n = 11) and from P5 to P7 (P = 2.1×10⁻⁶, n = 12). By contrast, in mutants, although normalized vessel density also increased from P3 to P5 (P = 10−6, n = 9), it grew at a slower rate. Moreover, there were no significant changes from P5 to P7 (P = 0.77, n = 12). Similarly, in controls, normalized branching frequency increased significantly during the periods both from P3 to P5 (P = 0.0003, n = 10) and from P5 to P7 (P = 0.019, n = 9). By contrast, in mutants, it remained not significantly changed during the period either from P3 to P5 (P = 0.29, n = 9) or from P5 to P7 (P = 0.17, n = 9). Scale bar in (A), 200 μm for (A–H).

