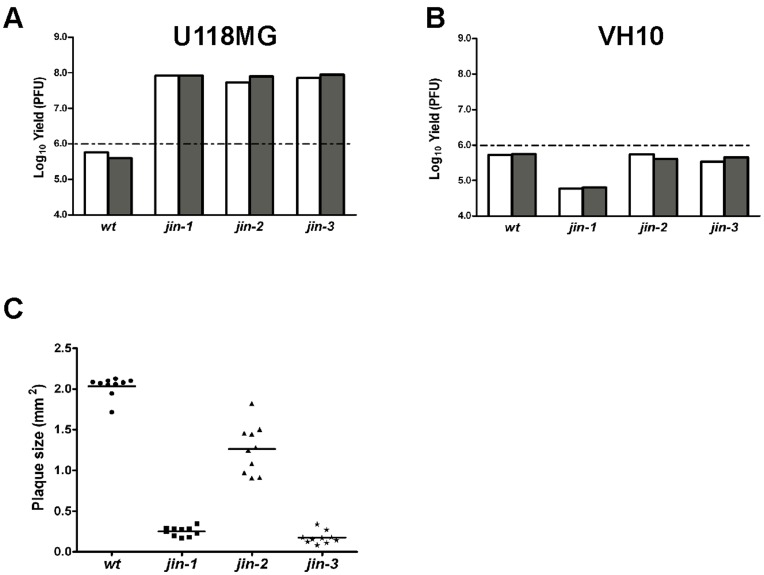
Figure 3. Comparison of wt T3D with jin-viruses in terms of plaque size, yield in U118MG cells and primary human fibroblasts (VH10 cells).
(A) Yield of wt T3D and jin-1, jin-2 and jin-3 mutants from U118MG cells infected with MOI 10 per virus. Yields were determined 72 hours post infection by plaque assays on 911 cells. The graph shows yields (Log10 PFU) of two independent U118MG cell infections: first one is shown as a white bar and second as a grey bar. The dashed line represents the input amount of the initial infection. (B) Yield of wt T3D and jin-1, jin-2 and jin-3 mutants from VH10 cells infected with MOI 10 per virus. Yields were determined 72 hours post infection by plaque assays on 911 cells. The graph shows yields (Log10 PFU) of two independent VH10 cell infections: first one is shown as a white bar and second as a grey bar. The dashed line represents the input amount of the initial infection. (C) Plaque sizes of wt T3D and jin-1, jin-2 and jin-3 mutants in 911 cells. Surface areas of 10 plaques per virus were measured four days post infection with Olympus DP-software.

