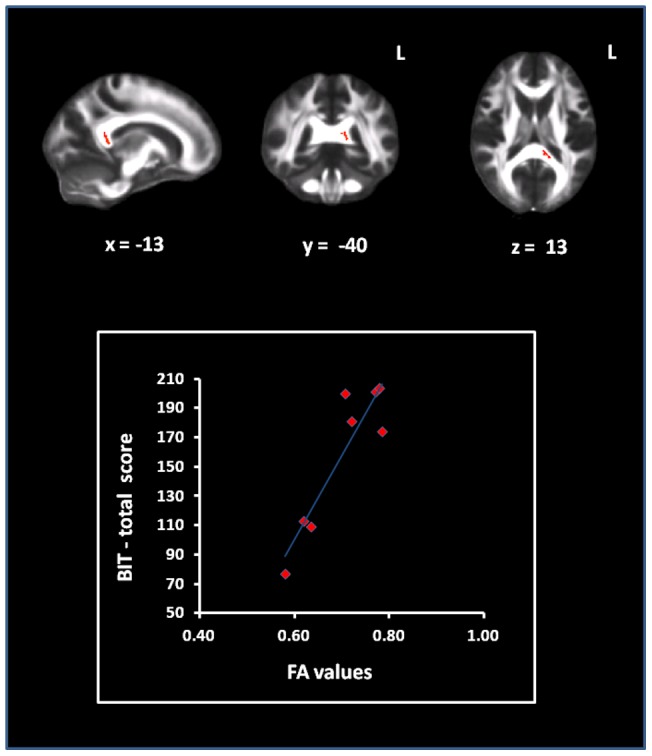
Figure 4. Correlation between patients' FA and BIT scores.

In top panel it is illustrated the region of the posterior corpus callosum , whose fractional anisotropy (FA) value correlates with patients' performance at Behavioural Inattention test (BIT). In the bottom panel, the FA values extracted from that region are plotted, patient by patient, against their correspondent performance obtained at BIT. The post-hoc R value (Pearson correlation coefficient) was 0.91.
