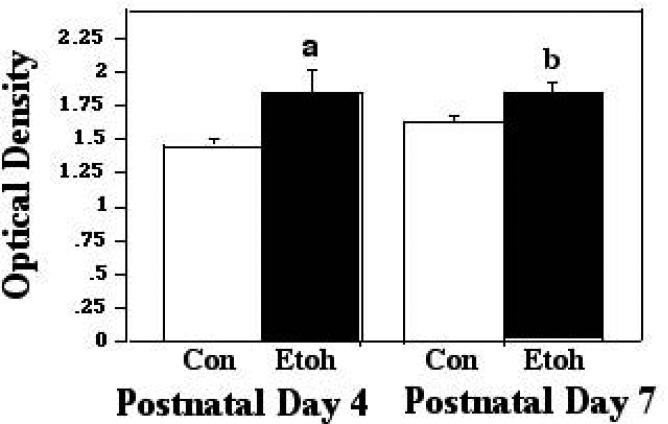
Figure 3A.
Bax:ANT associations were measured by ELISA in tissue derived from P4 and P7 neonatal rat cerebellum, with tissue collected two hours into exposure to ethanol via vapor inhalation (Etoh), or to control conditions (Con). Error bars represent standard error of the mean (SEM). a=Significantly greater than P4 controls, p=0.0407; b=significantly greater than P7 controls, p=0.0218.

