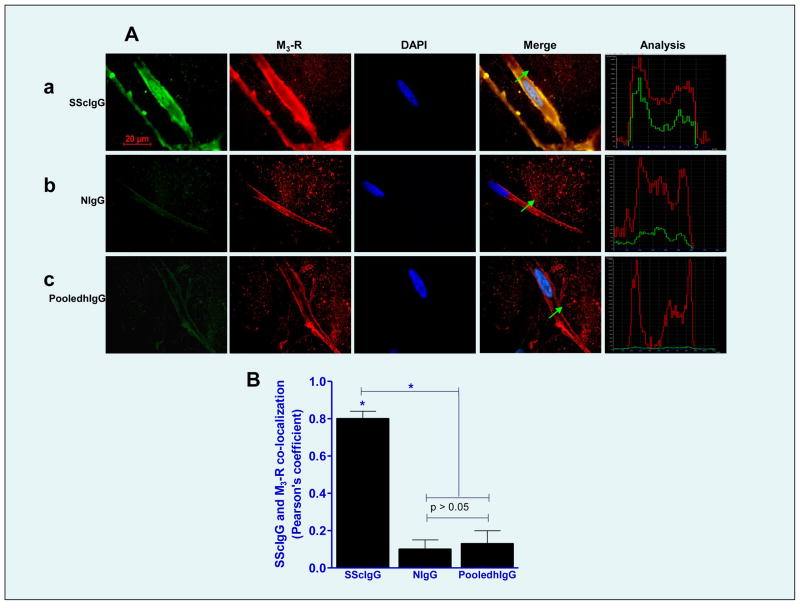
Fig. 3.
A. A. Immunocytochemical colocalization of different IgG preparations (SScIgG, a; NIgG, b; and pooledhIgG, c; (all FITC-conjugated; green)) and M3-R (TR-conjugated; red) and nucleus is stained blue with DAPI. Line graph analyses for the localization of these IgGs on the SMC membrane and their corresponding colocalization with M3-R are shown on the extreme right of each IgG plate. (B) Bar graph data show significant colocalization of SScIgG (vs. NIgG and pooledhIgG) with the M3-R at the SMC membrane.

