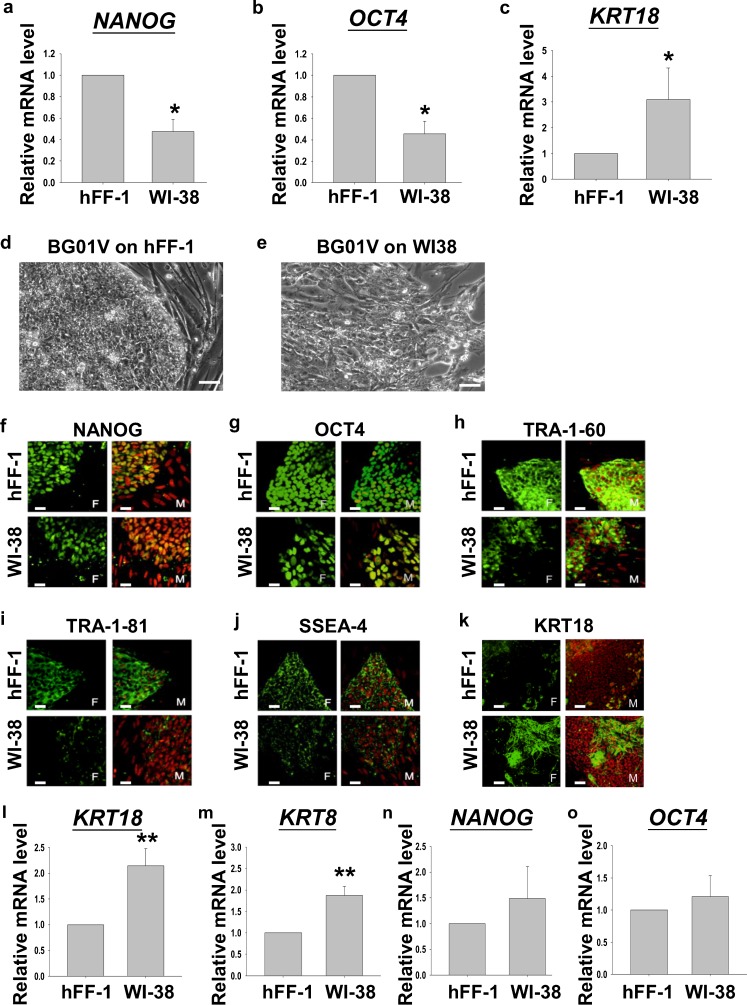
Fig. 1.
a–c Relative mRNA levels of NANOG, OCT4 and KRT18 of H9 cultured on hFF-1 or WI-38 feeder layers (n=4). d, e Representative images of BG01V cultured on hFF-1 or WI-38 for 6 days. Bars 5 μm. f–k Immunofluorescent staining of pluripotent markers (NANOG, OCT4, TRA-1-60, TRA-1-81, SSEA4) and early differentiation marker (KRT18) in BG01V cultured on hFF-1 and WI-38 (F fluorescence, M merged images of fluorescence and propidium iodide). Bars 5 μm. l–o Relative mRNA levels of the early differentiation markers (KRT8, n=7; KRT18, n=9) and pluripotent markers (NANOG, n=5; OCT4, n=9) in BG01V cultured on hFF-1 and WI-38. *P<0.05, **P<0.01

