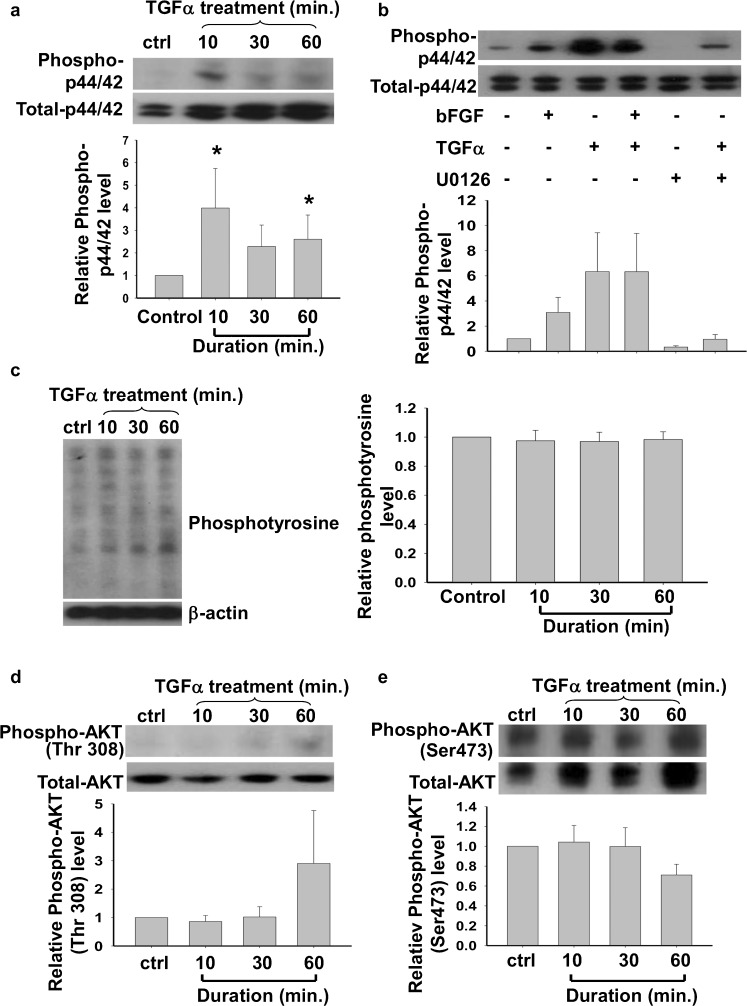
Fig. 6.
a, b Effects of TGFα on the relative expression levels of phosphorylated p44/42 in H9 after treated with (a) TGFA for 10, 30, or 60 mins (n=5; ctrl control) and (b) basic fibroblast growth factor (bFGF), TGFα and/or U0126 (n=5). c Relative level of phosphotyrosine in H9 after TGFα treatment (n=7). d, e Relative level of phosphorylated Akt at Thr308 and Ser473 in H9 after TGFA treatment (n=6). Statistical analysis was performed by one way analysis of variance. *P<0.05

