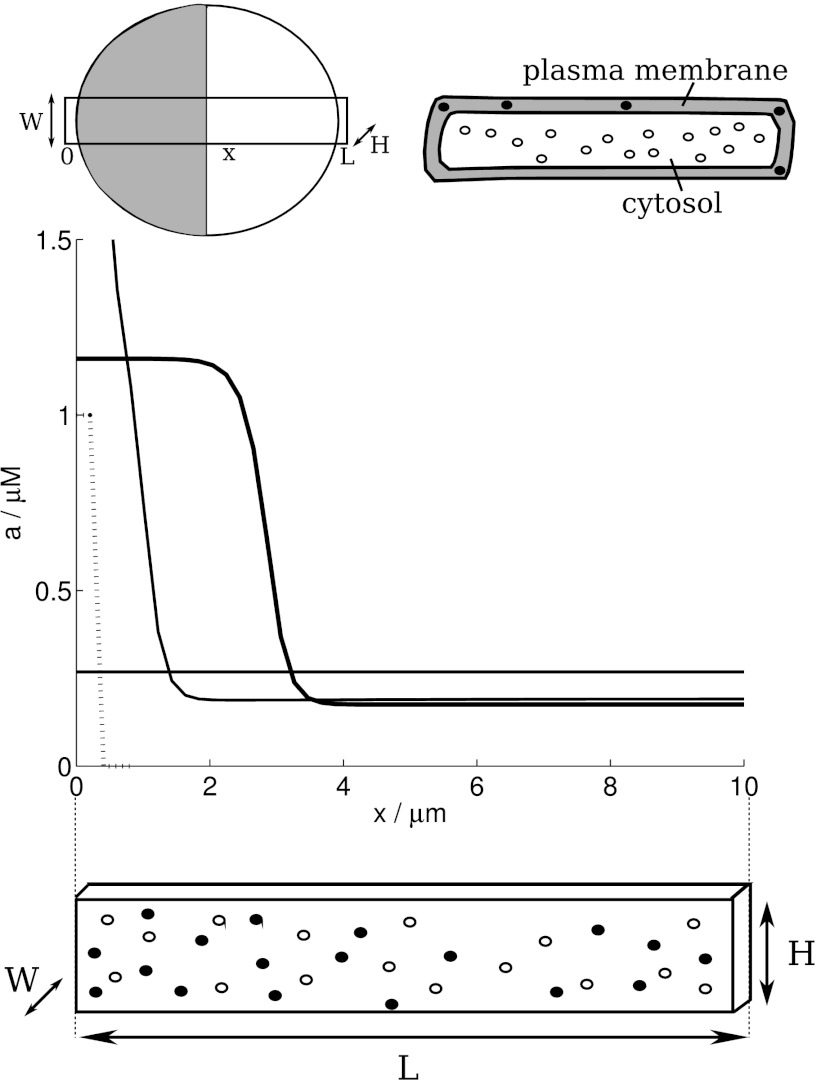
Fig. 1.
The modelled cell. (Top): Schematic diagrams of a cell showing the “slab” of length L, height H, and width W in a top–down view and two side-views. The model distinguishes membranous (A, solid circles) and cytoplasmic (B, open circles) proteins only by their distinct rates of diffusion. A typical “polarisation” state is shown in grey/white in the top–down view. (Bottom): In the deterministic polarisation model (1a), (1b) proposed by Mori et al. (2008), a small stimulus (dashed line, not to scale) produces a pinned wave (solid black line). The notations x/μm and a/μM along the graph axes indicate that the x- and y-axis variable carry units of μm and μM, respectively. Same notations have been used throughout the paper

