Fig. 10.
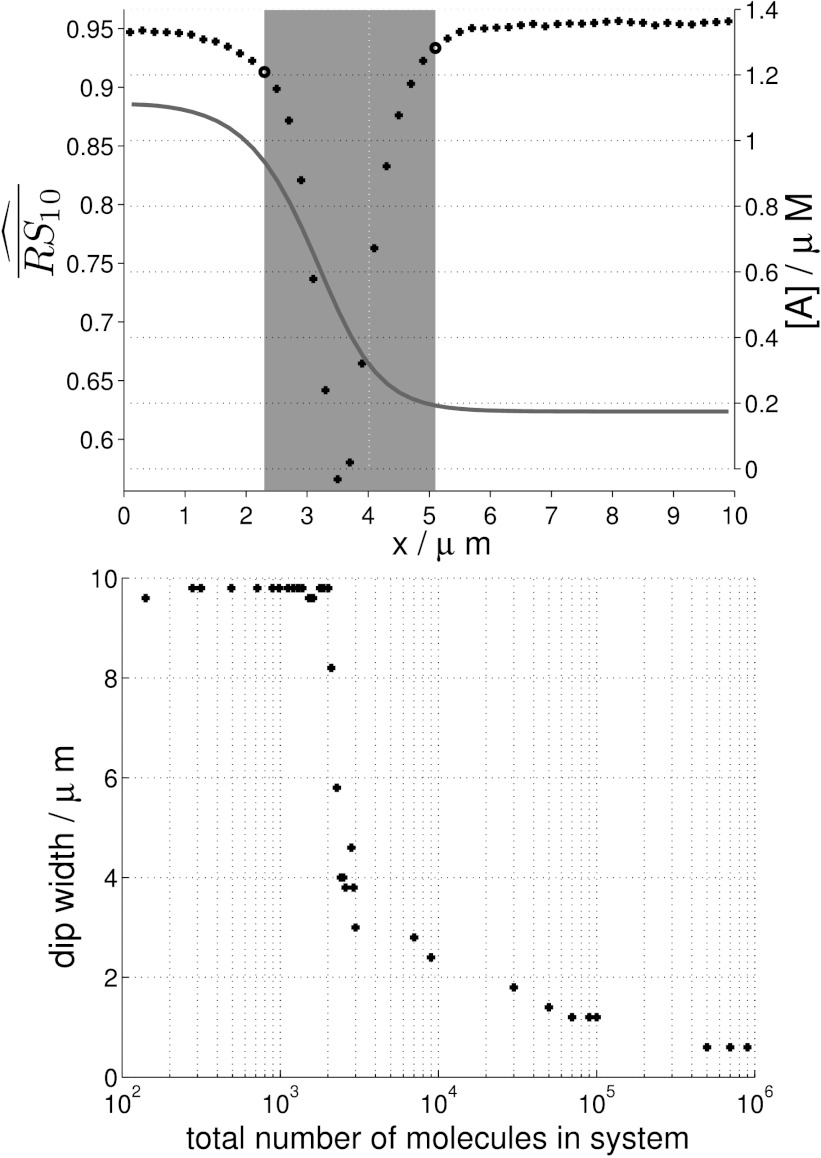
Noisy transition zone. (Top) Averaged spatial auto-correlation estimate, Eq. (8), lag k=1 s, with deterministic solution as in Fig. 6 for reference. Bold circles: delimiters of auto-correlation dip, highlighted by shaded area. This figure shows correspondence of a dip in spatial auto-correlation with the transition zone of the pinned wave. (Bottom) As in top figure, mean auto-correlation dip width (width of grey rectangle in top figure) over 100 SSA runs, as a function of total number of molecules. When the dip width approaches the length of the domain of the cell (10 μm), the pinning position stops conferring information that can be used by the cell. We note a sudden and drastic increase in width at approximately 2,000 molecules. Simulation parameters as in Fig. 6, except for W which is varied

