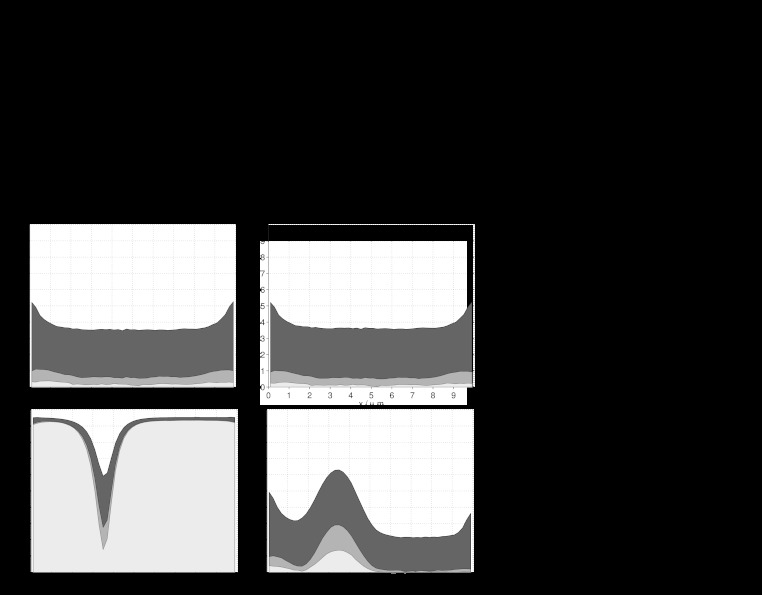
Fig. 11.
Fluctuations in space and time. Spatial/temporal auto-correlation sample mean (over J=100 SSA runs) with lag k=1 s (dark grey), k=10 s (grey), and k=20 s (light grey). (Top row) 702 molecules (W=0.25 μm). (Top left) Spatial auto-correlation. (Top right) Temporal auto-correlation. (Bottom row) 6,820 molecules (W=2.5 μm). (Bottom left) Spatial auto-correlation. (Bottom right) Temporal auto-correlation. The plots in the top row show that for sufficiently few molecules both spatial and temporal autocorrelation are almost uniform and show no pattern for the equilibrium state (pinning position). In the bottom row and for a sufficiently high number of molecules, spatial auto-correlation reveals a clear pattern in the equilibrium state with the dip in autocorrelation robust across different lags k. In the same copy-number regime, temporal auto-correlation shows a pattern for small lags k which, however, vanishes for increasing values of k. Simulation parameters as in Fig. 6, except for W

