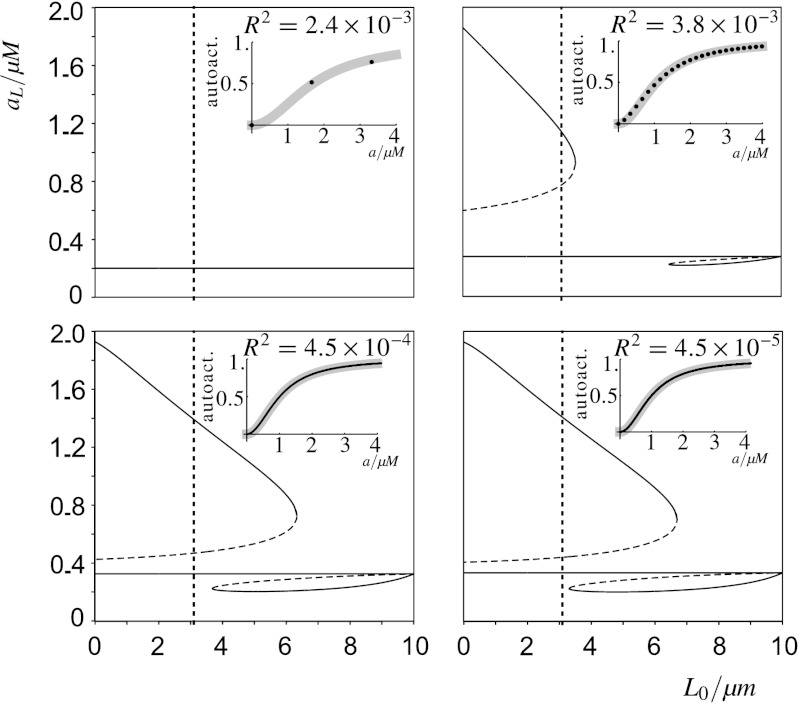
Fig. 14.
Predicted effect of stochasticity on the auto-activation term and its consequences for wave-pinning. Bifurcation diagrams to analyse the polarised cell state, as in Fig. 12, for four different box volumes V a (top left: 0.001 μm3; top right: 0.01 μm3; bottom left: 0.1 μm3; bottom right: 1.0 μm3). The different bifurcation diagrams are made by varying the parameter values γ and K of the Hill-type auto-activation γa 2/(K 2+a 2). The effective parameter values γ and K for small box sizes are determined as follows: For the mean number of molecules of active A being equal to 0,1,2,… molecules per box (indicated by the black dots in the insets), a Poisson distribution for that number of molecules is assumed in order to calculate an expected rate of auto-activation. These observed values are then fitted to the auto-activation term itself using a least-squares fit. The fitted auto-activation functions are shown as grey lines in the insets, together with the residual sums of squares, R 2. We observe that while the fitted γ hardly differs from the originally used value (γ≈1), the fitted K increases as box volume decreases. The bifurcation diagrams show that this change in effective auto-activation lowers the higher plateau and narrows the range of permissible L 0 values. Note that the difference between the lower panels is virtually undetectable. Indeed, both are almost equivalent to the bifurcation diagram for the deterministic system, which was shown in Fig. 12. It illustrates that a volume of V a=0.1 μm3 (bottom left) forms the upper bound for observing this stochastic effect. This corresponds to 137 molecules per box, given that the total concentration is 2.268 μM. The lower bound for wave-pinning to occur is reached when the effective K becomes 1.07, at a box size of V a=0.009 μm3, corresponding to 14 molecules per box

