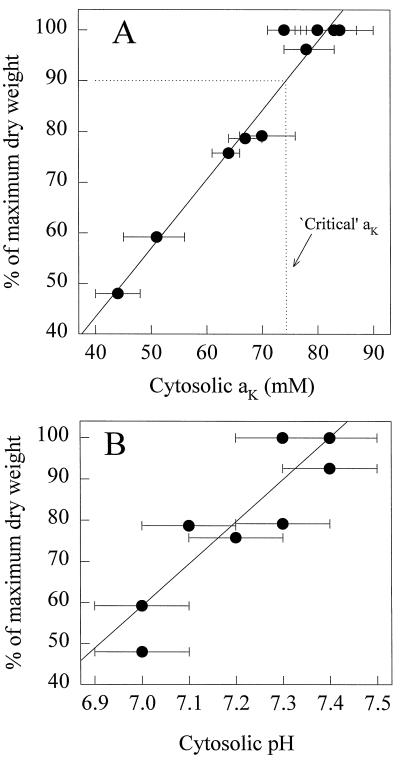
Figure 3.
Relationship between seminal root growth (expressed as a percentage of the dry weight of the seminal roots of plants growing in FNS containing 5 mm K+) and cytosolic aK (A) and pHc (B) of expanding barley root cells. In A, the fitted linear regression is y = 1.359x − 10.976 (r2 = 0.997, n = 11). Critical aK is defined as the concentration at which growth was 90% of the maximum (Ulrich and Hills, 1967). In B, the fitted linear regression is y = 102.46x − 658.08 (r2 = 0.976, n = 11). The root dry weight of plants growing in 5 mm K+ was assumed to represent maximum growth and was not significantly different from that of plants growing in 0.5 mm K+.

