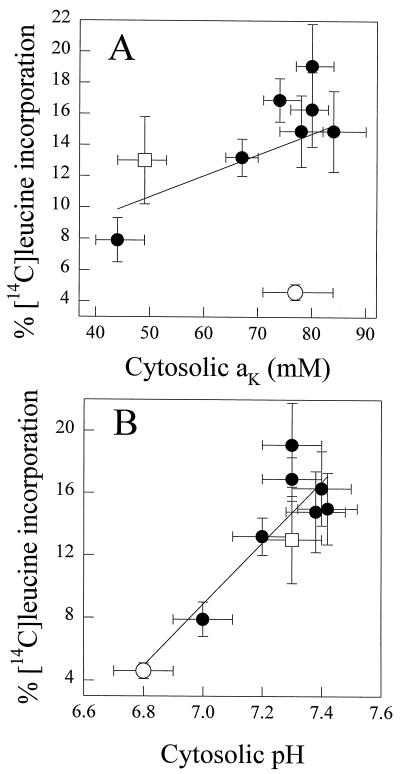
Figure 4.
Relationship between the rate of protein synthesis and cytosolic aK (A) and pHc (B) of expanding cells of barley root tips. The fitted linear regressions are: A, y = 0.135x + 3.90 (r2 = 0.183, n = 9); B, y = 19.59x − 128.1 (r2 = 0.790, n = 9). Protein synthesis was measured as the percentage incorporation of 14C-labeled Leu. The roots were treated with butyrate (○) or procaine (□). The remaining symbols represent seedlings supplied with different K+ concentrations (Walker et al., 1996).

