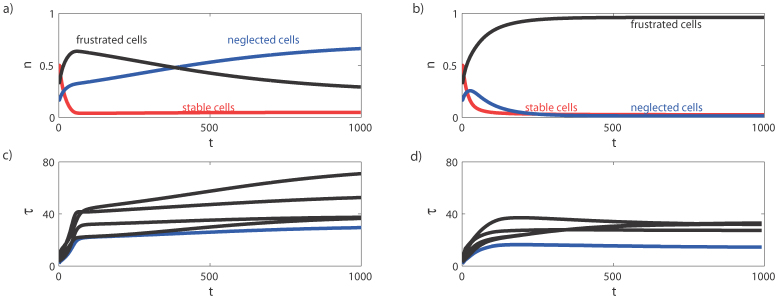
Figure 6. Impact of positive and negative selection on the evolution of T cell frequencies for the simplified model in Figure 5.
In a) and c) only negative selection is applied. In b) and d) positive and negative selection are applied simultaneously. Initially there are only non-conjugated cells with frequencies  ,
,  ,
,  ,
,  (i = 1,12) and
  . In a) and c),
  , while in b) and d),
  . Lines in blue in a) and b) represent the total number of T cells with ILists represented in blue in Figure 5; in red are represented the total number of T cells that establish stable conjugations; in black are represented the total number of T cells engaging in frustrated interactions. In c) and d) are displayed conjugation lifetimes for the most relevant conjugates in the population. As stable cells are eliminated, their lifetimes are not represented. The conjugate with the largest lifetime in c) corresponds to conjugate A1TI(21), whereas in d) these conjugates A2TI(21) and A2TI(23). These results show that if no positive selection is applied, neglected T cells accumulate, and the maximum conjugation lifetimes are larger than in the model in which positive selection is applied and these cells are eliminated. These results agree with numerical results obtained for cellular automata with more ligands (see SM8).

