Figure 6.
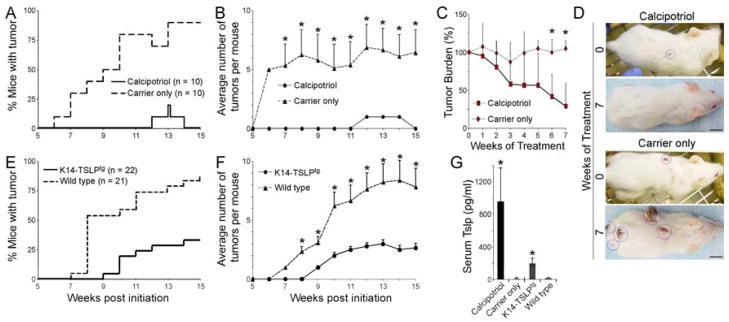
TSLP creates a tumor-suppressing environment in the wild-type skin. (A,B) DMBA-TPA treated CD1 wild-type animals were topically treated with calcipotriol or carrier (EtOH), (A) time to tumor onset (p <0.0001, log-rank test) and (B) average number of tumors among tumor-bearing animals are shown. n = 10 for each group; error bars represent +/− SEM; *: p <0.01, student’s t-test. (C,D) The 8 tumor-bearing carrier-treated mice shown in “A&B” were randomly divided into two groups at the end of the 15-week DMBA-TPA treatment course. The “test” group was treated with 32 nmol calcipotriol while the “control” group continued to receive carrier alone 5 times per week. (C) After an additional 7-week treatment period, the tumor burdens of the calcipotriol-treated and carrier-treated mice are compared. n = 4 in each group; *: p <0.05, student’s t-test; error bars represent +/− SD. (D) The representative pictures show the size of the remaining tumors in calcipotriol-treated versus carrier-treated mice at the end of the 7-week follow-up period. Tumors are highlighted with blue circles; scale bars: 1 cm. (E,F) K14-TSLPtg female mice and their wild-type female littermates treated with DMBA-TPA are compared for (E) time to tumor onset (p <0.0001, log-rank test) and (F) average tumor number among tumor-bearing animals. n = 22 for K14-TSLPtg group and n = 21 for wild-type group; error bars represent +/− SEM; *: p <0.01, student’s t-test. (G) Circulating TSLP levels in calcipotriol-treated and K14-TSLPtg animals are compared to their controls. Error bars represent +/− SD; *: p <0.0001 compared to wild-type group, student’s t-test.

