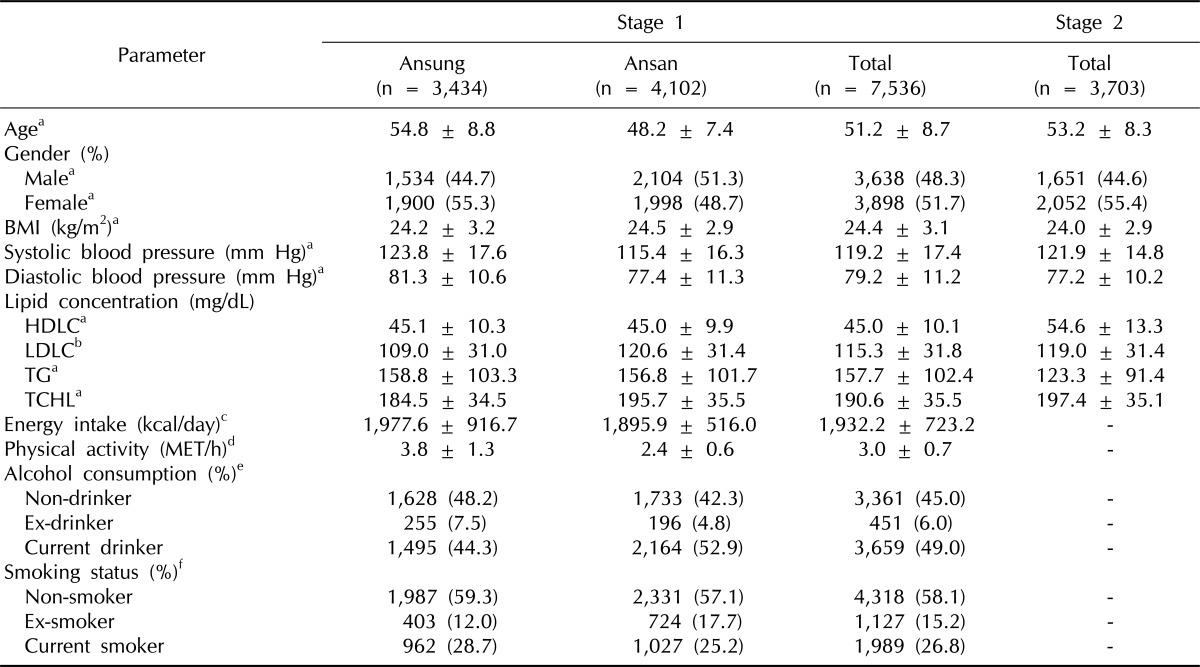
Table 1.
Description of subjects used in stages 1 and 2 of the study
Quantitative parameters are shown as mean ± SD or as the number observed, followed by its corresponding percentage.
BMI, body mass index; HDLC, high-density lipoprotein cholesterol; LDLC, low-density lipoprotein cholesterol; TG, triglyceride; TCHL, total cholesterol; MET, metabolic equivalent.
aMissing rate of the parameter is 0 in both stages I and II; bMissing rates of the parameter are 0.027, 0.025, 0.026, and 0.015 in Ansung, Ansan, total of stage I, and total of stage II, respectively; cMissing rates of the parameter are 0.056, 0.012, and 0.032 in Ansung, Ansan, and total of stage I, respectively; dMissing rates of the parameter are 0.021, 0.004, and 0.012 in Ansung, Ansan, and total of stage I, respectively; eMissing rates of the parameter are 0.016, 0.002, and 0.009 in Ansung, Ansan, and total of stage I, respectively; fMissing rates of the parameter are 0.024, 0.005, and 0.014 in Ansung, Ansan, and total of stage I, respectively.

