Figure 3.

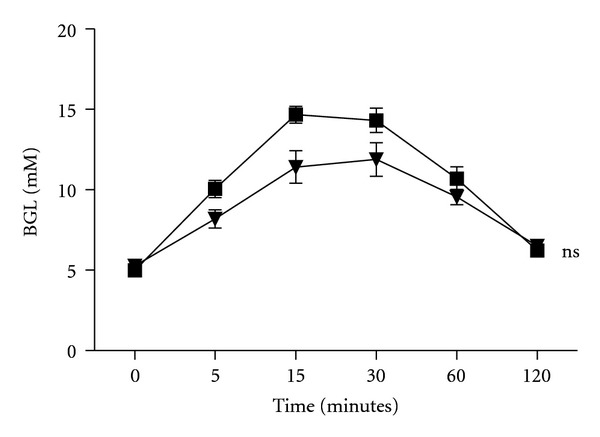
Normal glucose handling in CD73KO mice. Blood glucose levels following 1 mg/g BW of intraperitoneal glucose. WT mice (black squares, n = 6); CD73KO mice (black triangles, n = 8); ns—not significant versus WT mice.

Normal glucose handling in CD73KO mice. Blood glucose levels following 1 mg/g BW of intraperitoneal glucose. WT mice (black squares, n = 6); CD73KO mice (black triangles, n = 8); ns—not significant versus WT mice.