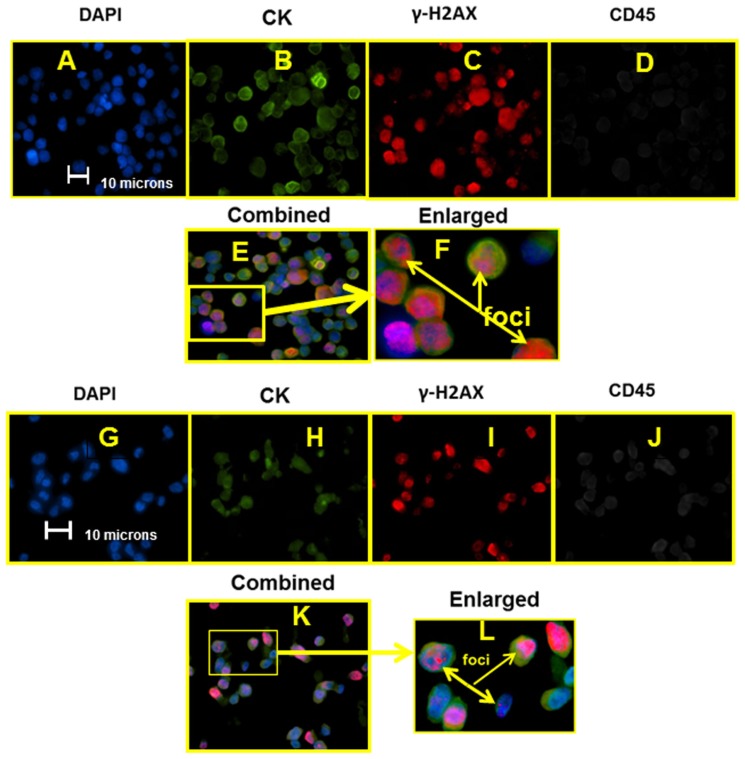
FIGURE 2.
Sets of epifluorescent images (A–F) for MCF-7 and (G–L) for MDA-MB-231. For (A–F) and (G–K), images are the same location, different filter settings corresponding to the stained marker/structure targeted and listed above the image. Figures (F) and (L) are the enlargements highlighted (E) and (K), respectively.

