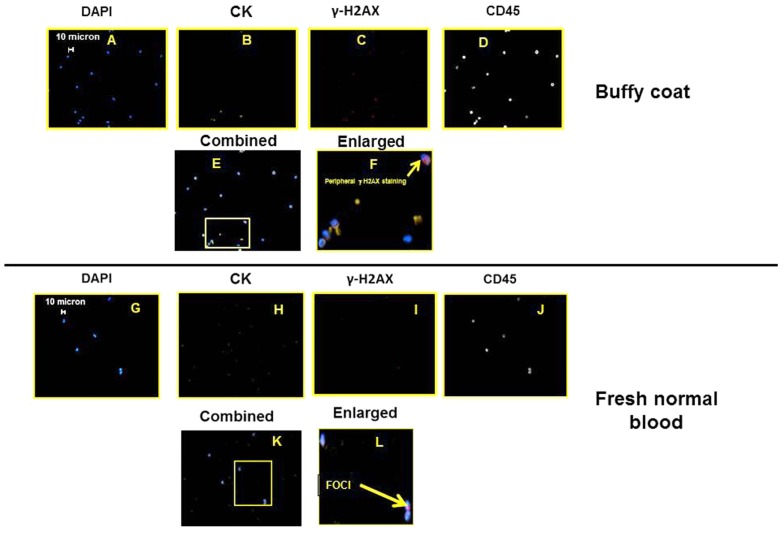
FIGURE 3.
Sets of epifluorescent images (A–F) for buffy coat and (G–L) for fresh, normal blood. For (A–F) and (G–K), images are the same location, different filter settings corresponding to the stained marker/structure targeted and listed above the image. Figures (F) and (L) are the enlargements highlighted (E) and (K), respectively.

