
Figure 1.
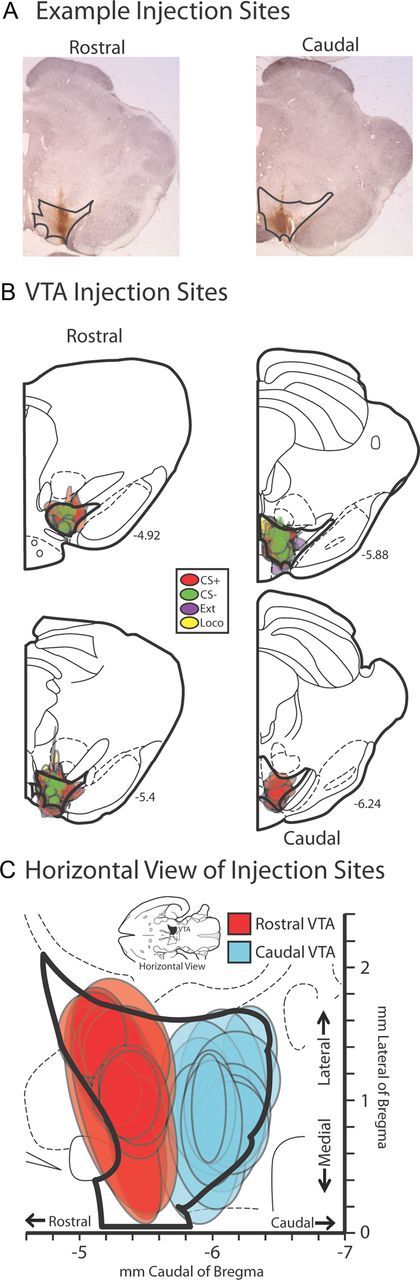
Localization of retrograde tracer injections in VTA. A, Representative examples of CTb injection sites in coronal views for rostral and caudal VTA. Darker black lines delineate the borders of VTA on each section. B, CTb injection sites from all animals are plotted in coronal views (mm caudal of bregma is noted for each slice). Colored areas represent the maximal extent of CTb injections in individual behaviorally tested animals. Red, cue reinstatement group (CS+); green, non-cocaine-associated cue control group (CS−); purple, extinction control group (Ext); yellow, novel environment locomotor control group (Loco). C, Injection sites from all animals are represented in a horizontal view, with colored areas representing maximal spread of CTb injection sites in individual animals, color coded based upon tracer placements in rostral (blue, n = 13) or caudal (red, n = 12) VTA. Coordinates relative to bregma are shown on the abscissa (rostral/caudal) and ordinate (medial/lateral).