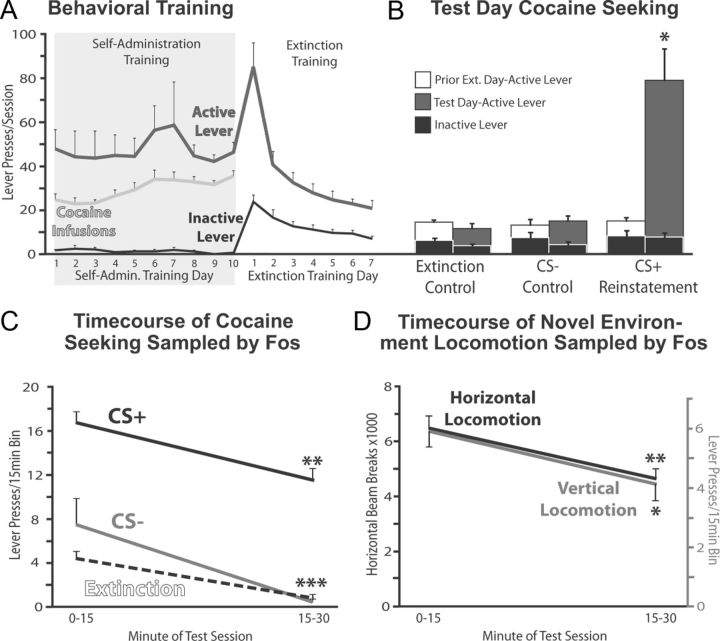
Figure 2.
Self-administration, extinction, cued reinstatement, and control behaviors. A, Active and inactive lever presses, and cocaine infusions are shown during the 10 days of self-administration, and first 7 d of extinction training. No differences in cocaine intake between groups were seen, so average data from all animals are displayed. B, Active lever (white and gray bars) and inactive lever (black bars) presses are shown on test days of extinction (n = 7), CS− (n = 4), and CS+ reinstatement animals (n = 8). Lever presses on the day of extinction training before tests are also shown for each group for comparison. *p < 0.05, increase in active lever presses from prior extinction day. C, Active lever pressing during the first and second 15 min of test day is shown for CS+ reinstatement, CS− control, and extinction control animals. **p < 0.01, ***p < 0.001, decrease in pressing from first 15 to second 15 min. D, Horizontal (black) and vertical locomotion (gray) during first and second 15 min is shown for the locomotor control group (n = 6). *p < 0.05, decrease from first 15 min in vertical locomotion; **p < 0.01, decrease from first 15 min in horizontal locomotion. Error bars indicate SEM.

