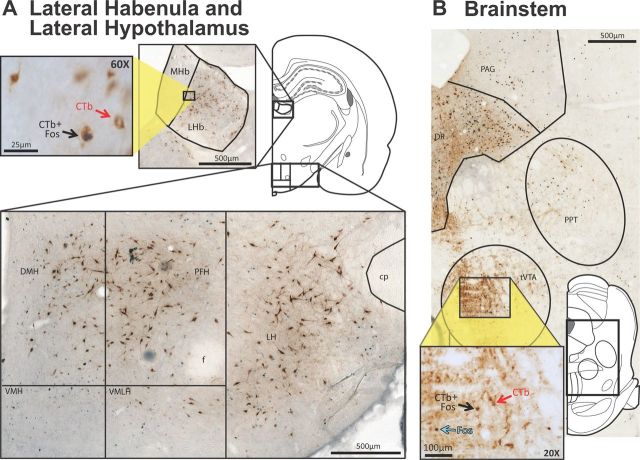
Figure 4.
Pattern of major projections to VTA from diencephalon and mesencephalon. A, Many CTb+ neurons were seen in LHb (top; inset shows a close up at 60× magnification), and in dorsal hypothalamus (bottom). B, Many CTb+ neurons were seen in DR, tVTA, PAG, and PPT. Inset shows 20× magnification photo within tVTA. cp, cerebral peduncle; DR, dorsal raphe nucleus; f, fornix; MHb, medial habenula; PAG, periaqueductal gray; PPT, pedunculopontine nucleus; VMH, ventromedial hypothalamus; VMLH, ventromedial portion of the lateral hypothalamus. Scale bars are shown in each panel.

