
Fig. 2.
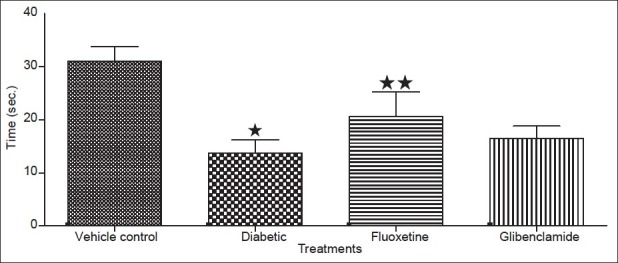
Effect of fluoxetine on grip strength after 9 weeks in diabetic rats. Data expressed as mean of three reading (s) for each animals in a group±sd, n = 5. ∗Values were statistically significant (P<0.05) compared to vehicle group. ∗∗Values were statistically significant (P < 0.05) compared to diabetic control group (student unpaired t test).