Fig. 4.

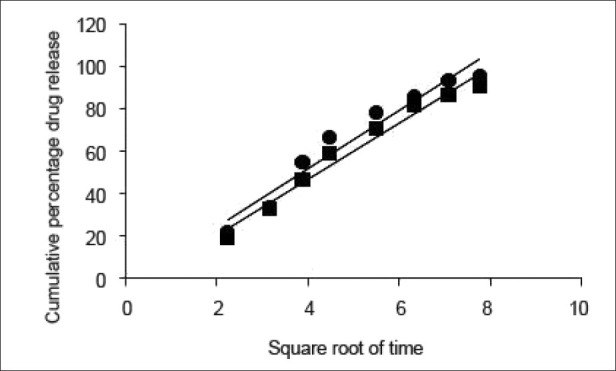
Higuchi model. Higuchi model for the batch B5 (■ y=13.75x-2.708, R2=0.948) and B7 (•; y=13.31x-6.268, R2=0.971). Each point represents the mean of three observations.

Higuchi model. Higuchi model for the batch B5 (■ y=13.75x-2.708, R2=0.948) and B7 (•; y=13.31x-6.268, R2=0.971). Each point represents the mean of three observations.