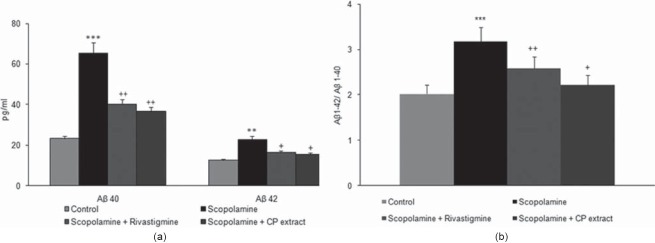
Figure 3.
Cortical Aβ1-40 and Aβ1-42 levels were measured by an ELISA assay according to the procedures illustrated in the methods section. (a) Displays the effect of various treatments groups [Control, Scopolamine treated (2 mg/kg), Scopolamine (2 mg/kg) + Rivastigmine (1 mg/kg), Scopolamine (2 mg/kg) + CP extract (150 mg/kg)] on the levels of Aβ1–40 and Aβ1–42. (b) The ratio of Aβ1–42/Aβ1– 40 following treatment for 4 weeks. Values shown are the mean ± S.E.M. ***P< 0.001 as compared with control group, +P < 0.05, ++P < 0.01 as compared with scopolamine treated group

