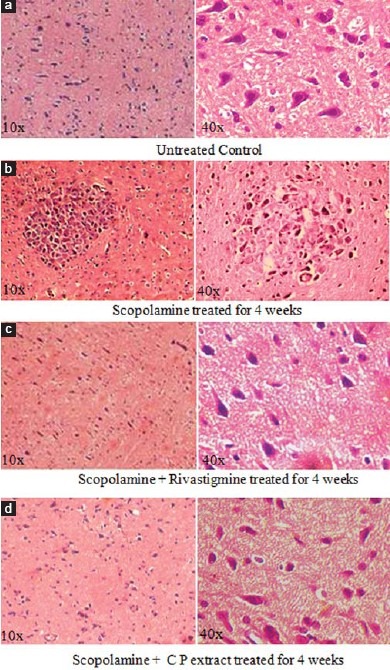
Figure 4.

Photographs (a-d) showing histopathological changes in cerebral cortex in different groups. (a) Control group (distilled water), (b) Scopolamine treated (2 mg/kg) treated group, (c) Scopolamine (2 mg/ kg) + rivastigmine tartrate (1 mg/kg), treated group, (d) Scopolamine (2 mg/ kg) + CP extract (150 mg/kg) [H and E 10× and 40×]
