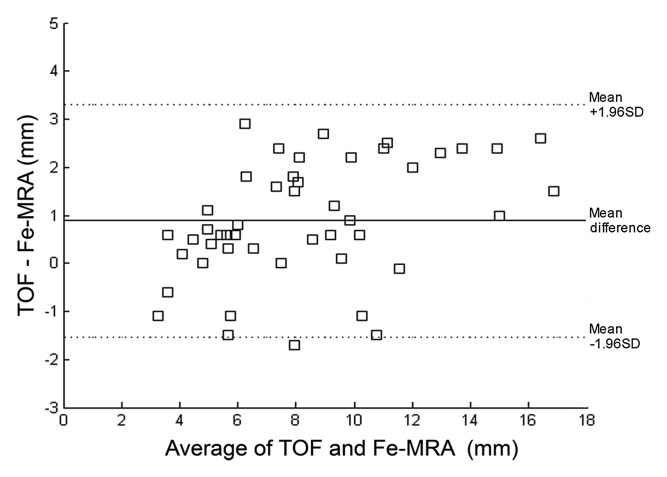
Figure 5b:
(a) Scatterplot and linear regression for the lumen diameters measured with TOF MR angiography and ferumoxytol-enhanced MR angiography (Fe-MRA) from all patients. Slope, intercept, and R2 values are 0.8, 0.8, and 0.89. (b) Bland-Altman plot for the relationship between TOF and ferumoxytol-enhanced MR angiography measured lumen diameters.

