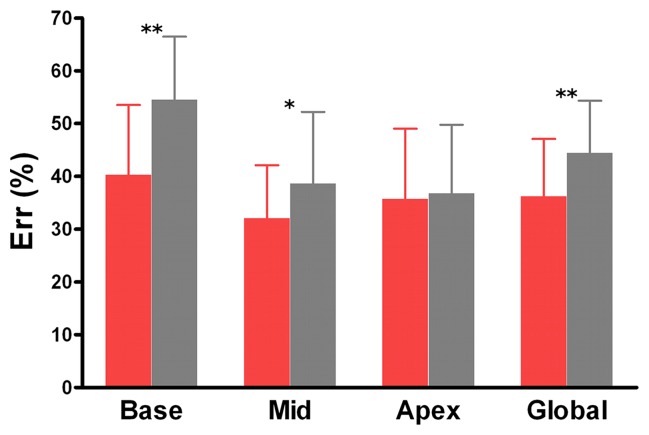
Figure 2b:
Graphs show mean values of maximal systolic strain assessed at cine DENSE MR imaging at basal, mid, and apical levels of LV and in the whole heart (global) in patients with type-2 DM (red bars) and control patients (gray bars). For comparisons of patients with type-2 DM and control patients, P < .05 (asterisk) and P < .01 (double asterisk). Error bars = standard deviation.

