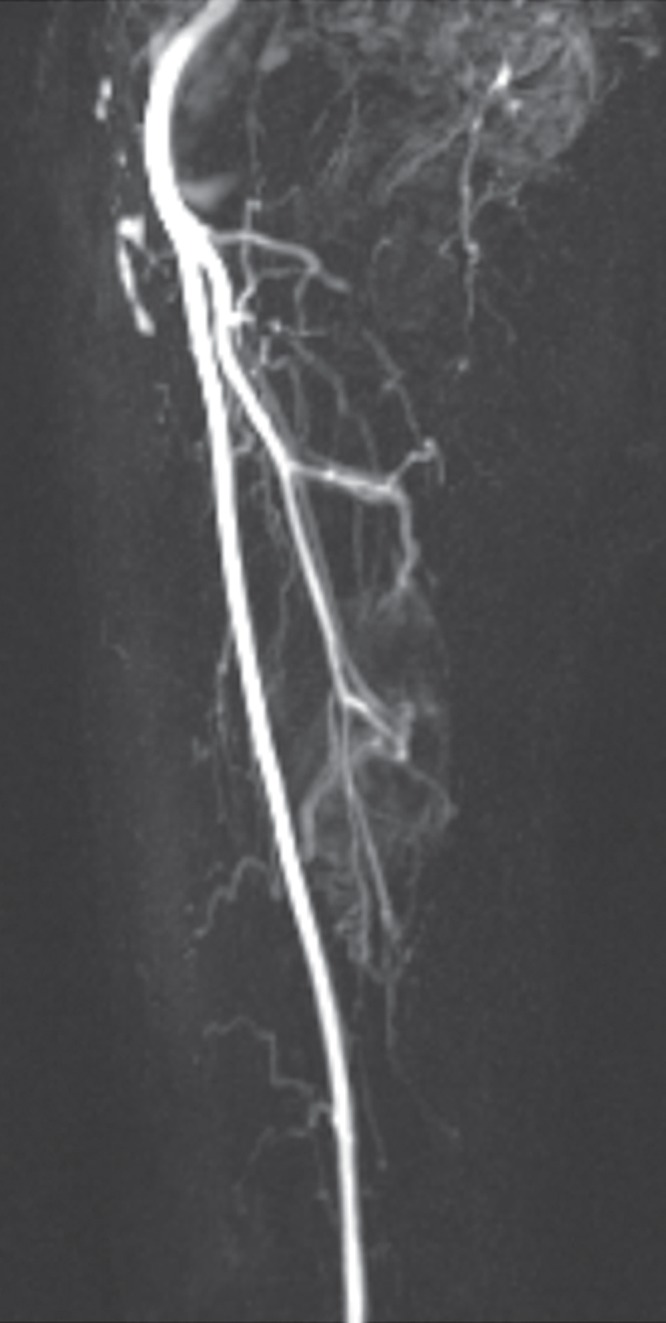
Figure 2k:

Pleomorphic rhabdomyosarcoma in an 81-year-old woman. Images were obtained (a–f) before and (g–l) after chemotherapy. (a) Axial T1-weighted MR image (466/16) shows lesion as fairly isointense to skeletal muscle with relatively subtle loss of normal muscle architecture. (b) Axial fat-suppressed T2-weighted MR image (3380/60) shows lesion to better advantage with good contrast resolution between mass and surrounding muscle. (c) ADC map shows low signal intensity in the mass and a range of ADCs from 0.9–1.1 × 10⁻³ mm2/sec. (d) Proton MR spectroscopy (point-resolved spectroscopy, 2000/135) shows discrete choline peak at 3.2 ppm (arrow). (e) Axial contrast-enhanced MR image obtained at perfusion imaging (TWIST, 3.4/1.2) 20 seconds after contrast agent administration shows avid early arterial enhancement in the lesion, in keeping with its malignant nature. (f) Coronal delayed contrast-enhanced MR image (volumetric interpolated breath-hold examination, 4.1/1.5) obtained by subtracting nonenhanced from contrast-enhanced images shows enhancement throughout the mass. This sequence, in addition to the T1-weighted and fluid-sensitive sequences, also provides a good anatomic image for evaluating the lesion and its relationship to adjacent structures. Pleomorphic rhabdomyosarcoma in an 81-year-old woman. Images were obtained (a–f) before and (g–l) after chemotherapy. (g) Axial T1-weighted MR image (466/16) shows that lesion remains subtle although decreased in size and of slightly altered signal intensity compared with its pretreatment appearance, now having slightly increased signal intensity relative to that of skeletal muscle. (h) Axial fat-suppressed T2-weighted MR image (3380/60) again shows interval decrease in size of the mass, now with more heterogeneous signal intensity, as compared with pretreatment image. Signal intensity changes after treatment are often identified and are not contributory toward interpretation of whether tumor has undergone treatment-related necrosis. (i) ADC map shows increased signal intensity with range of ADCs of 1.6–2.2 × 10⁻³ mm2/sec., a substantial difference compared with pretreatment images, suggesting interval treatment-related necrosis. (j) Proton MR spectroscopy (point-resolved spectroscopy, 2000/135) shows interval marked decrease in choline peak at 3.2 ppm (arrow), now very close to baseline noise level, also indicating that treatment-related necrosis has occurred. (k) Coronal contrast-enhanced MR image obtained at perfusion imaging (TWIST, 3.4/1.2) 20 seconds after contrast agent administration shows little if any arterial enhancement in the lesion, a substantial difference compared with the pretreatment image. (l) Coronal delayed contrast-enhanced MR image (volumetric interpolated breath-hold examination, 4.1/1.5), obtained by subtracting unenhanced from contrast-enhanced images, now shows evidence of heterogeneous enhancement in the lesion. Final histologic examination after surgical resection revealed 90% treatment-related sclerosis, 5% necrosis, and 5% viable tumor. In this case, contrast enhancement represents, in part, treatment-related sclerosis (scar tissue) rather than viable tumor, but these two entities are indistinguishable on delayed contrast-enhanced studies, underscoring the need for perfusion examination when attempting to evaluate treatment response.
