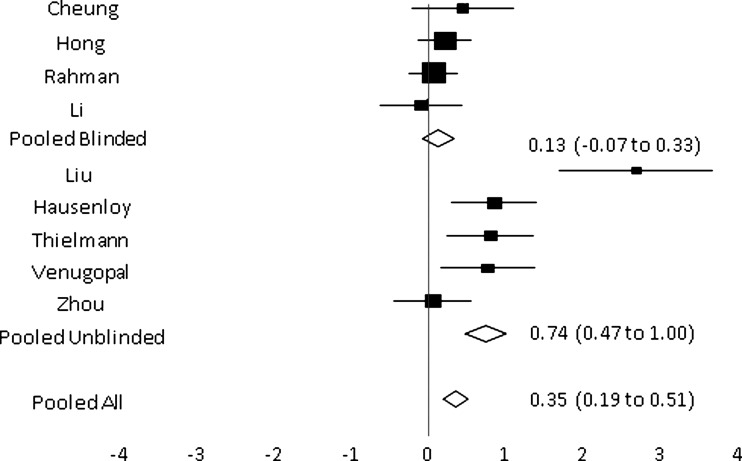
Figure 3.
Combined forest plot for mean postoperative troponin at 12 hours following surgery demonstrating pooled results from the grouping of trials as fully blinded and incompletely blinded. The size of the boxes on the forest plot is inversely proportional to the size of the variance of the study estimates so that more precise studies have larger boxes

