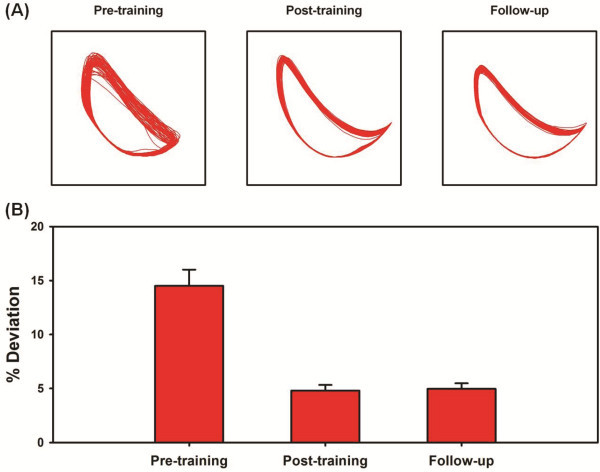
Figure 3.
(A) Ankle trajectory of the paretic leg during baseline walking at the three time-points of evaluation. (B)Bar graphs representing the kinematic variability of the ankle trajectory during baseline walking. The variability was calculated by determining the area that was not common to both the ensemble average of the baseline ankle trajectory and the actual baseline trajectory during each gait cycle. The resulting area was normalized to the area of the ensemble average of the baseline trajectory in order to compute% deviation. Error bars represent the 95% confidence intervals (between-stride). Note that the variability of the ankle trajectory reduced by about two-folds with training and was maintained at the follow-up evaluation.

