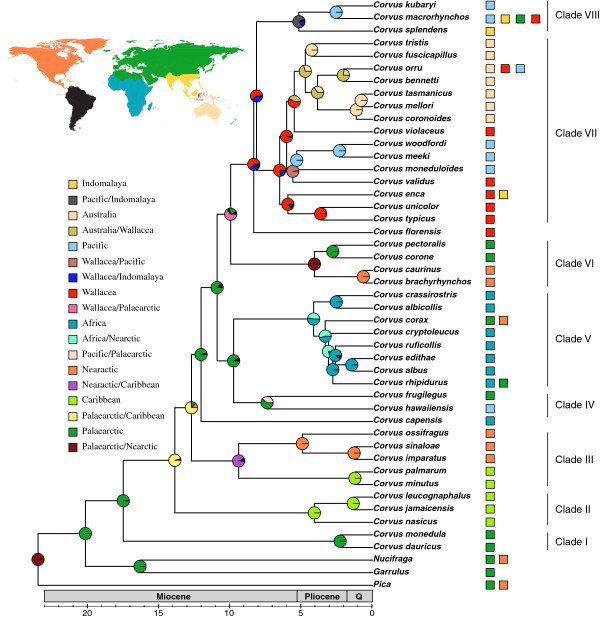
Figure 2.
A summary of the BAYES-LAGRANGE ancestral area analysis for the genus Corvus. The tree is a chronogram (pruned to include one individual per species) based on the BEAST dating analysis of a combined data set of mitochondrial (ND2 and ND3) and nuclear (GAPDH and ODC) DNA sequences. Pie charts at internal nodes indicate the probability of a given area of origin. The inset map indicates the regions demarcated for the ancestral area analyses and colours to the right of the taxon names indicate present distributions (Nearctic, Palaeearctic, Caribbean, Africa, Indomalaya, Wallacea, Australo-Papua and Pacific) and thus coding for the ancestral area analyses. Black parts of the pie charts indicate a mixture of other areas.

