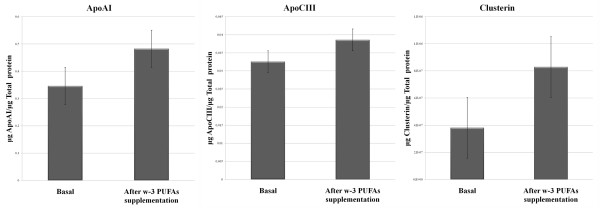
Figure 3.
Expression levels of apoAI, apoCIII and clusterin. Protein expression levels were divided by total protein concentration in order to normalize values. Expression level of apoAI and apoCIII were measured by MILLIPLEX MAP assays and clusterin levels was measured by ELISA in participants Lp-AI particles. Changes in protein expression level were all of them statistically significant (p < 0,05).

