
Figure 4.
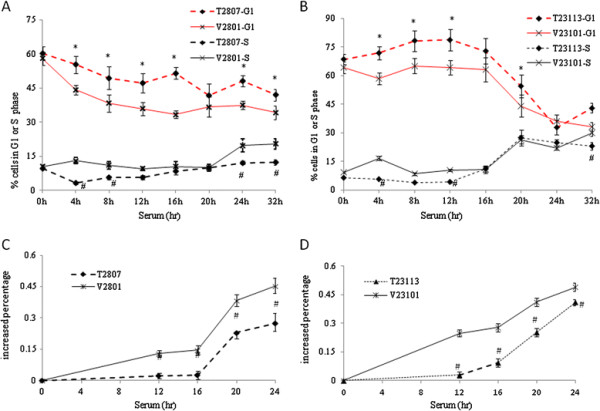
TGFBI during G1 phase arrest and S phase delay. (A) Mesothelioma and (B) breast tumor cell lines with and without re-expressed TGFBI were collected at different times, cell cycle profiles were assessed by flow cytometry. Line graphs and plots illustrate the distribution of cells in G1 and S phases over 32 h. Representative proliferation of (C) mesothelioma and (D) breast tumor cell lines with and without TGFBI re-expression assessed using a CyQUANT NF proliferation kit at the indicated points in time. The proliferation rate is expressed as increased percentages [(fluorescence intensity at time t-fluorescence intensity at 0 h)/fluorescence intensity at 0 h]. All growth data were generated from three independent experiments (error bars; mean ± SD). * Indicates significant increases over vector control cells (P < 0.05). # Indicates significant decreases relative to vector control cells (P < 0.05).