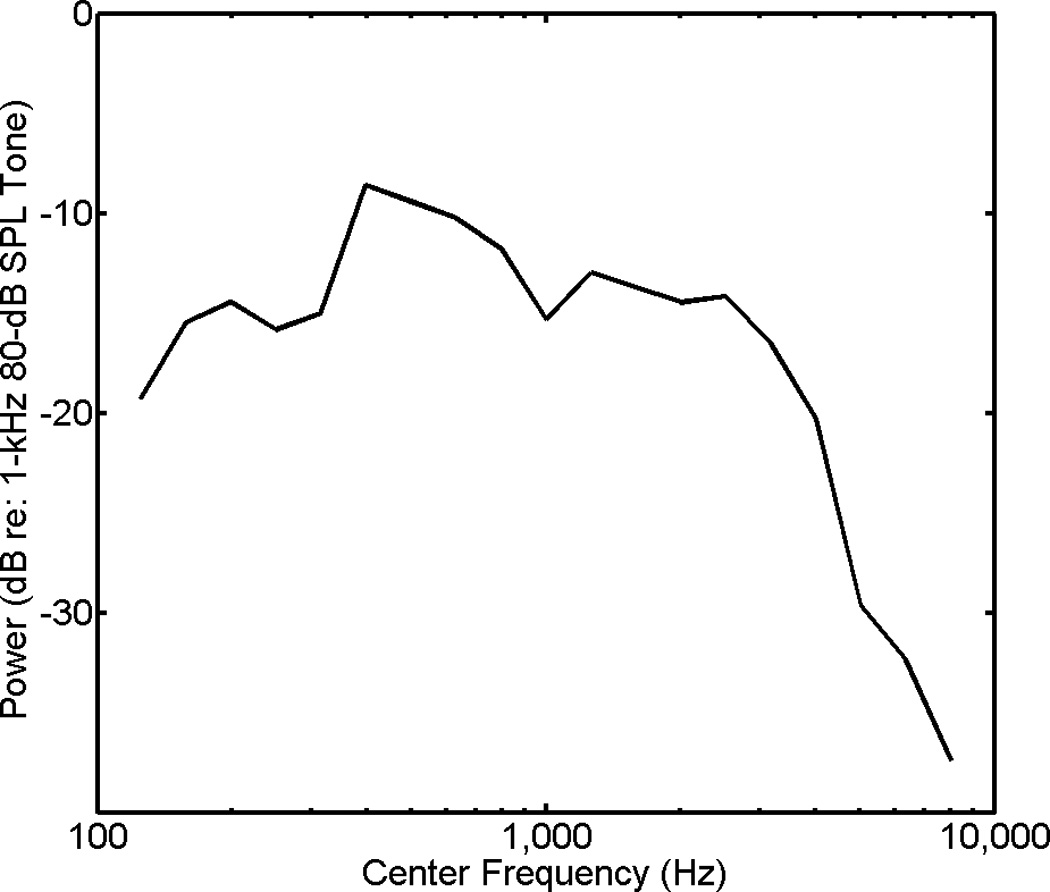
Fig. 5.

Average power spectrum of the speech-babble masker recorded through a KEMAR manikin as a function of the center frequency of the consecutive one-third-octave bands used in analysis. Levels are expressed in dB relative the power of a 1-kHz pure-tone with both the masker and pure tone presented separately at 80 dB SPL.
