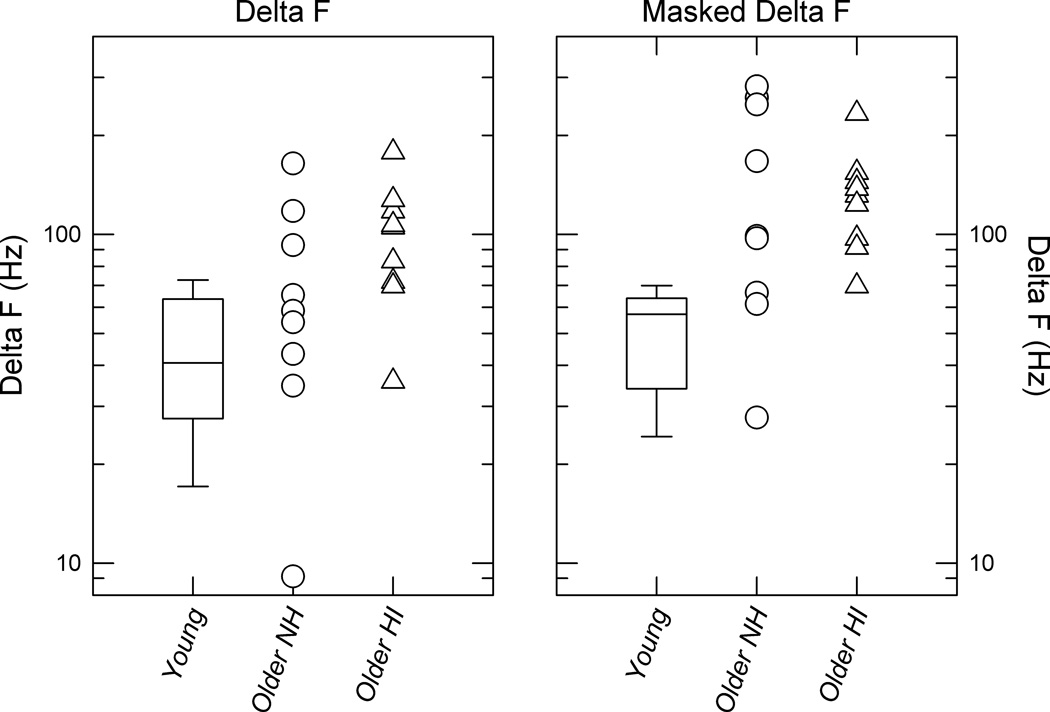
Fig. 6.
For the three subject groups, thresholds from the Delta F and Masked Delta F conditions in the left and right panels, respectively. The box plot at the left in each panel shows the median threshold from the younger listeners; the upper and lower box edges indicate the 25th and 75th percentiles with error bars showing the 10th and 90th percentiles. Individual results from the older NH and HI subjects are displayed as circles and triangles, respectively.

