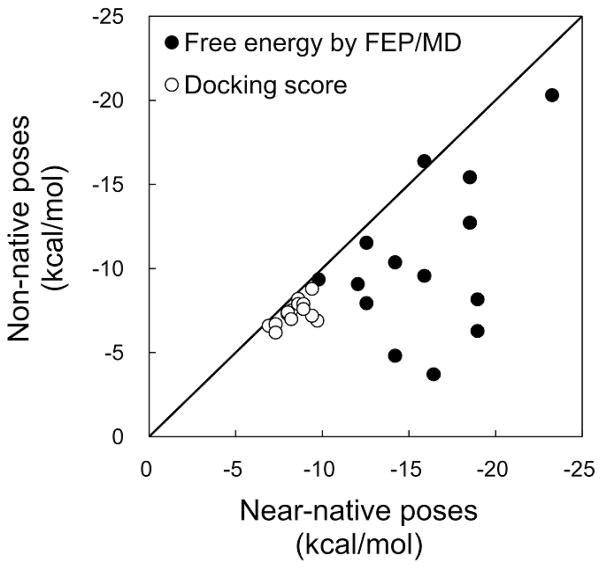
Figure 6.
Relationship between docking scores and FEP/MD binding free energies for near-native and non-native poses. Each data point in the plot represents a pair of docking scores (or free energy by FEP/MD) for near-native and non-native poses in a system. In the case of T-3 cognate-receptor docking (Table 3), for an example, two pairs can be generated from three docking poses (near-native pose + two non-native poses) selected by RMSDMD filtering.

