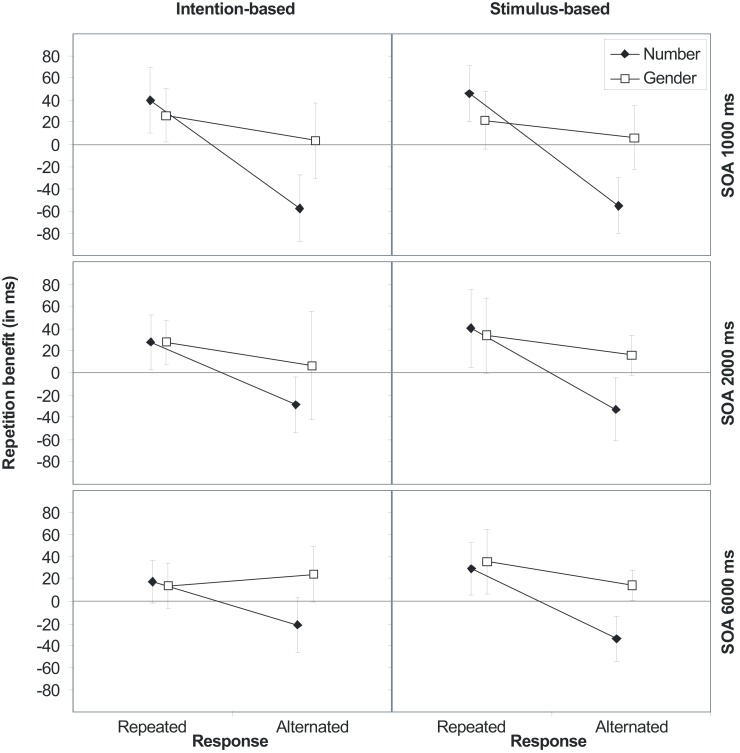
Figure 2.
Stimulus (S1–S2) repetition benefits (RTalternation-RTrepetition) in Experiment 1 for stimulus features number and gender for intention-based (left panels) and stimulus-based trials (right panels) as a function of response relation (R1–R2 repetition or alternation) and stimulus-onset asynchrony (SOA 1000, 2000, and 6000 ms, from top to bottom). Error bars represent the 95% confidence interval of individual means. If error bars do not cross the midline, the repetition benefit (or cost) is significantly different from zero (p < 0.05).

