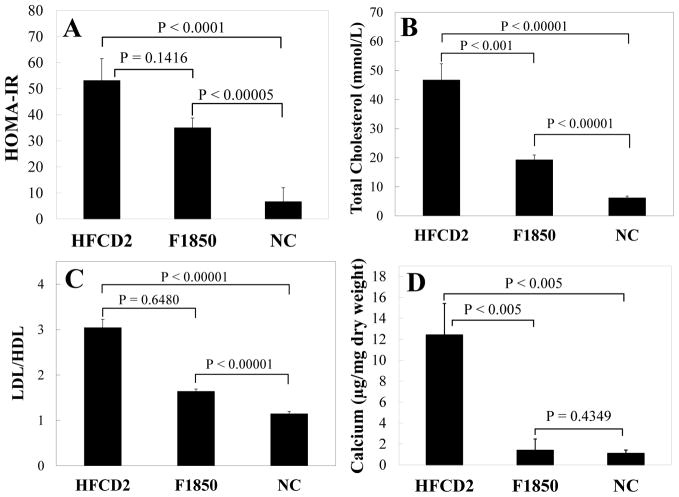
Figure 4. The role of hypercholesterolemia in vascular calcification of T2DM LDLr−/− mice.
LDLr−/− mice were fed with respective diets for 24 weeks. Fasted blood glucose and insulin levels were measured and HOMA-IR (A) was calculated as described in Figure 3. Total cholesterol (B), LDL/HDL cholesterol ratio (C), and calcium content of aortic arches (D) were determined as described in “Methods”. Data shown are mean±SEM, n=10–13.

