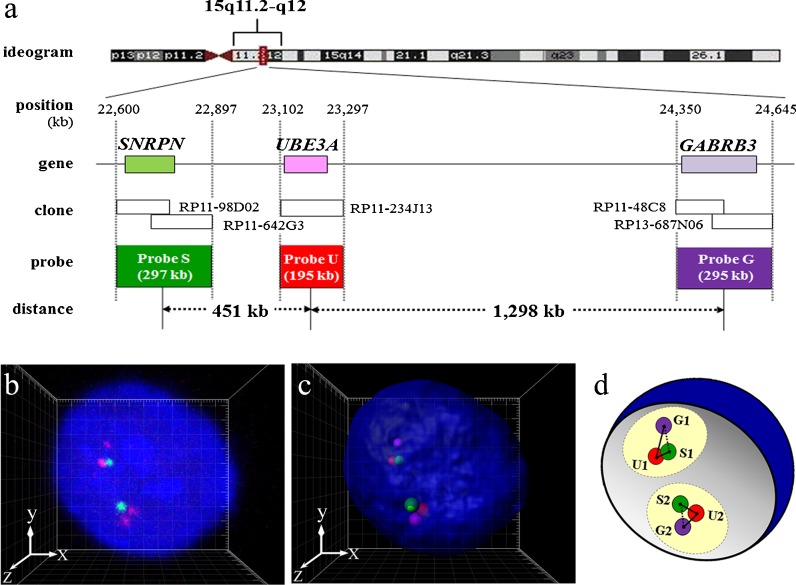
Fig. 1.
a Probe design for three-color 3D-FISH analysis of the target region on human chromosome 15q11.2–q12. b, c Visualization of three-color 3D-FISH on structurally preserved human LCL nuclei and an image of 3D distance measurements. FISH with probes S (green), U (red), and G (magenta), showing the SNRPN, UBE3A, and GABRB3 genes, respectively. Nuclei were counterstained with DAPI (blue). 3D reconstruction (c) was carried out from the captured image (b) obtained with Imaris software. Each signal spot was generated using the coordinate value from the FPC of each probe (i.e., probes S (green), U (red), and G (magenta)). Grid space, 1 μm. d Scheme of the relative 3D intergenic distance measurements. Circles colored light yellow represent the assumed chromosome territories 15. SIU1 < S2U2 distance

