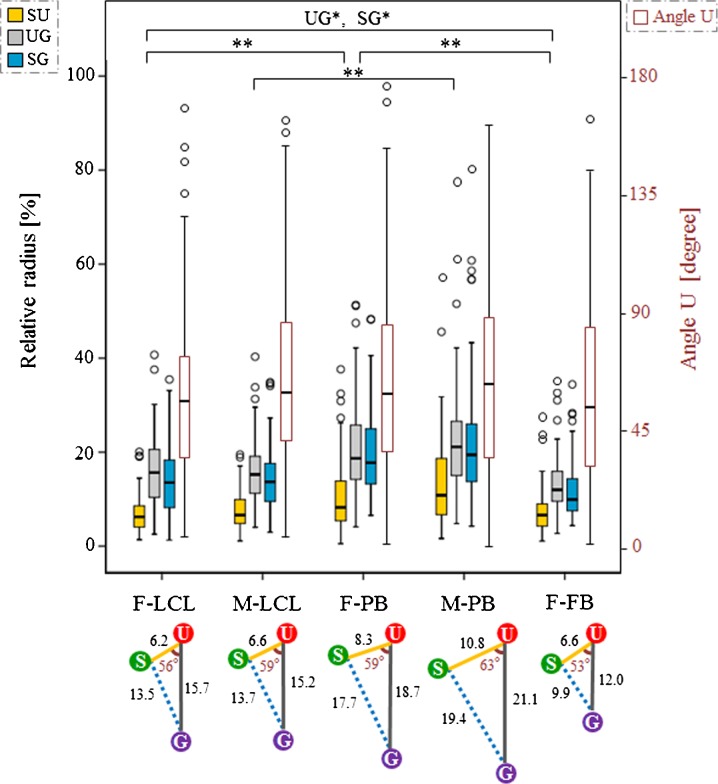
Fig. 3.
Gene-to-gene distance of SU/UG/SG and angle U for each subject. The colored box and whisker plots show the distributions of SU, UG, and SG gene distance (corrected value, relative radius), and the red box and whisker plots show the distributions of angle U. Angle U is defined as the internal angle formed by the SU and UG sides. The left axis in the graph shows the relative radius and the right axis the angle U. The box plot summarizes data obtained using the median, upper, and lower quartiles, as well as the range. Boxes represent the 25th to 75th percentiles (IQR). The solid line within the boxes indicates the median. Lower and upper whiskers show the 10th and 90th percentiles, respectively, of the distribution. Open circles indicate outliers. For the SU/UG/SG distance and the angle U, P values were obtained using the Mann–Whitney test between different cell types of the same individuals (F-LCL, F-PB, and F-FB; M-LCL and M-PB) and between identical cell types from different individuals (F-LCL and M-LCL; F-PB and M-PB). A P value < 0.008 was considered statistically significant after correcting for multiple comparisons (Bonferroni’s correction, α = 0.05/6 = 0.008; *P < 0.008; **P < 0.001; n = 100 alleles, 50 nuclei) The bottom schema presents the summarized configuration of SNRPN, UBE3A, and GABRB3 genes in the nucleus for each subject, cited according to the corrected median value of the SU/UG/SG distance and the angle U (Table 1)

