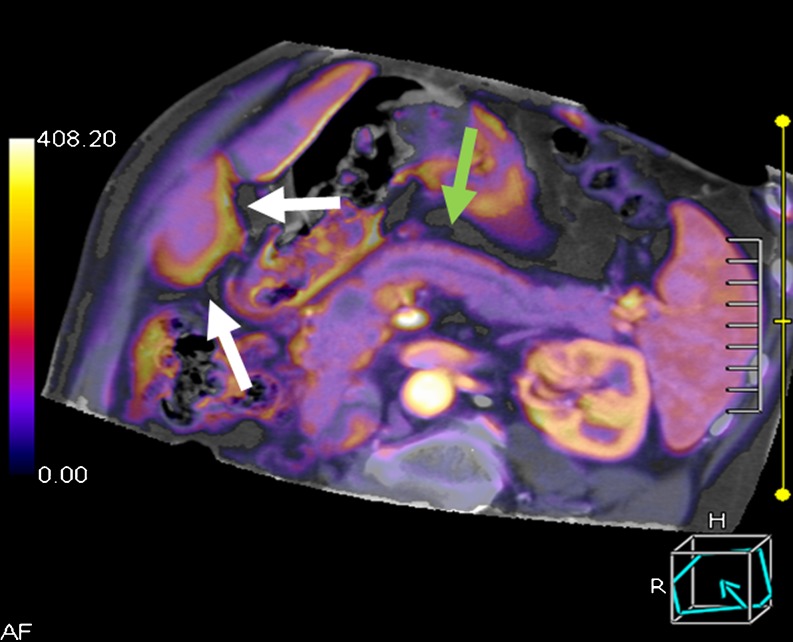
Fig. 1.
Colour-coded map of the pancreas with a small pancreatic carcinoma and ductal dilatation calculated based on maximum slope analysis (multiplanar reformation). After image registration, the borders of the pancreas are well defined (green arrows), whereas the lower edge of the liver exhibits registration artefacts (white arrows)

