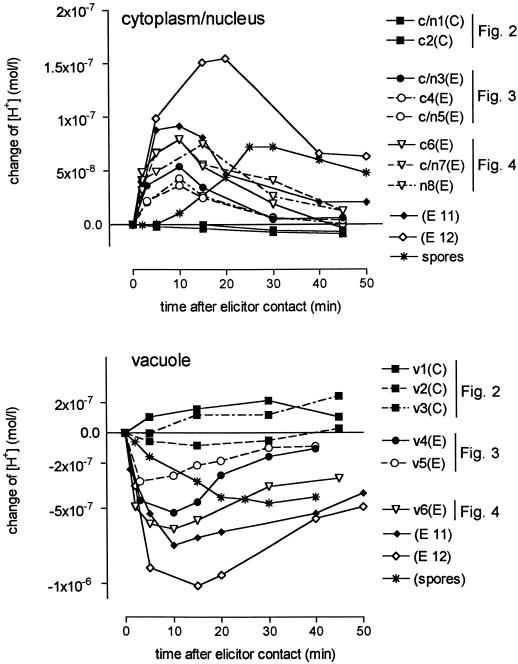
Figure 5.
A collection of pH traces measured in control and elicitor-treated cells. y axis, Increase of proton concentration compared with time 0, i.e. the time of adding elicitor or the start of the first scanning period (control cells). Some of the data are derived from the pH maps of Figures 2, 3, and 4. This is indicated together with the corresponding area numbers. Analyzed areas of the same cell are represented by similar symbols, e.g. c/n3 and v4. (E), Elicitor treated; (C), control cell; c, cytoplasmic area; c/n, cytoplasmic area including the nucleus; and n, nucleus. Elicitor concentrations: ▪ (control), no elicitor; •, 1 μg/mL purified yeast elicitor, 30 to 100 kD; ▿, ♦, and ⋄, 5 μg/mL crude yeast elicitor; ✽, conidiospores of P. cyclopium (autoclaved), 6 × 10⁵/mL.

