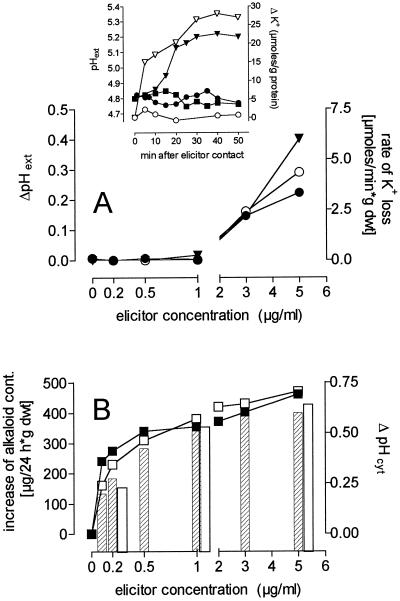
Figure 6.
Concentration dependence of elicitor-triggered effects. The effects of the crude elicitor preparation (closed symbols and hatched columns) and of the 30- to 100-kD elicitor fraction (open symbols and open columns) are demonstrated with respect to the following criteria: A, The maximum increase of pH of the growth medium seen within 50 min (▾, left ordinate) and the initial rate of increase of external K+ (•, ○, right ordinate; data were obtained by nonlinear regression of efflux curves such as those shown in the inset). The changes of external K+ content and pHext (if any) of elicitor-free control cultures were subtracted from the measured data. Inset, pHext and changes of the K+ concentration in the outer medium of elicited cell suspensions; pHext (left ordinate): ▪, control; •, elicitor 1 μg/mL; ▾, elicitor 5 μg/mL; external K+ content (right ordinate): ○, elicitor 1 μg/mL; ▿ elicitor 5 μg/mL. Data from elicitor-free control suspensions were subtracted. B, The maximum decrease of cytosolic pH (pHcyt) seen within 30 min (columns, right ordinate) and the increase of total alkaloid content within 24 h (▪, □, left ordinate). Each data point is averaged from three to four measurements, and sd values are as follows: pHcyt, 0.03 unit; alkaloid content, 6% to 9%; pHext, 0.05 unit; K+ content, 10% to 17%. The alkaloid formation of elicitor-free control suspensions was subtracted. Three independent experiments with 5-d cell suspensions yielded similar results. dwt, Dry weight.

