Figure 2.
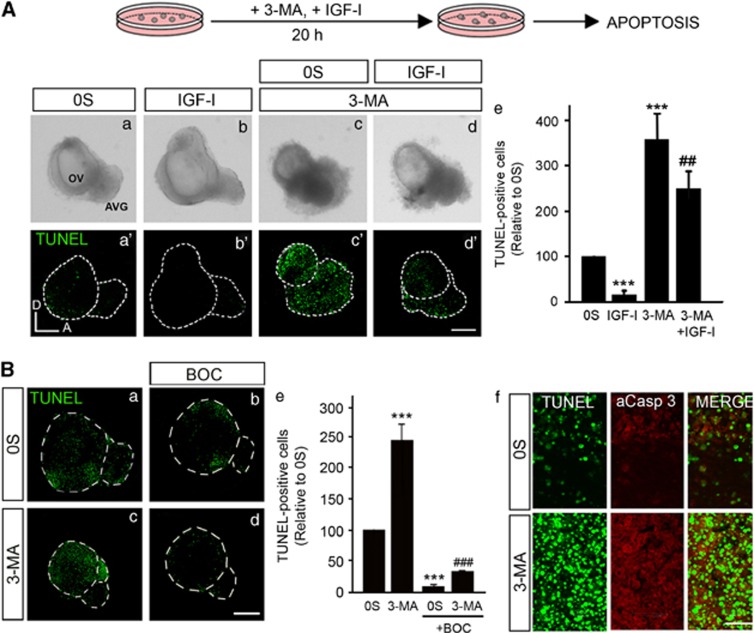
Inhibition of autophagy increases TUNEL-positive cells in cultured otic vesicles. (A) The schematic drawing shows the experimental design. (a–d, a′–d′) Otic vesicles were isolated from HH18 chicken embryos, made quiescent and cultured for 20 h in the 0S condition with IGF-I (10 nM), 3-MA (10 mM) or a combination of both. Apoptotic cell death was visualized by TUNEL (green). Bar=150 μm. (e) TUNEL-positive nuclei were quantified with Image Analysis Software (Olympus, Tokyo, Japan) relative to the 0S condition, which was given an arbitrary value of 100. Data are the mean±S.E.M. of at least five otic vesicles from the conditions shown. Statistical significance was estimated with the Student's t-test: ***P<0.005 versus 0S, ##P<0.01 versus 3-MA 10 mM. (B) (a–d) Otic vesicles were isolated from HH18 chicken embryos and cultured for 20 h in the 0S condition in the presence of 3-MA (10 mM) alone or in combination with the pan-caspase inhibitor BOC (50 μM). Cell death was visualized using the TUNEL technique. Bar=150 μm. (e) TUNEL-positive nuclei were quantified with Image Analysis Software (Olympus, Tokyo, Japan) relative to the 0S condition, which was given an arbitrary value of 100. Data are the mean±S.E.M. of at least three otic vesicles from the conditions shown. Statistical significance was estimated with the Student's t-test: ***P<0.005 versus 0S, ###P<0.005 versus 3-MA 10 mM. (f) Apoptotic cell death visualized by TUNEL staining (green) and immunostaining for activated-caspase-3 (red) of a selected region from the otic vesicles cultured in 0S or in the presence of 3-MA 10 mM. Bar=20 μm. Compiled projections of confocal microscopy images from otic vesicles are shown. Orientation: A, anterior; D, dorsal. The images shown are representative of at least three independent experiments, using 5–6 otic vesicles per condition

