Figure 5.
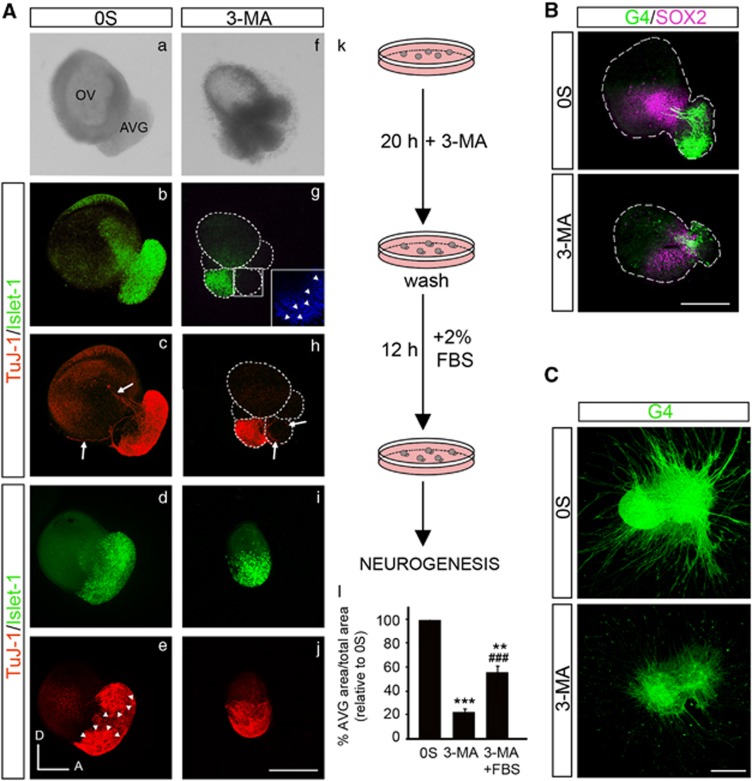
Autophagy inhibition impairs AVG formation. (A) (a–j) Otic vesicles were isolated from HH18 chicken embryos and incubated in the 0S condition or with 3-MA (10 mM) for 20 h. Secondly, they were washed briefly and were again incubated for 12 h in fresh medium with 2% of fetal bovine serum (FBS). Whole otic vesicles were then immunostained for the ganglion neuroblast nuclei marker Islet-1 (green) and for the marker of neural processes, TuJ-1 (red). The boxed area (g) shows a higher magnification of a region adjacent to the neural area where fragmented nuclei (visualized by DAPI, arrowheads) can be observed. Arrows show the neural processes extending towards the otic epithelium (c) and towards the accumulation of dead cells (h). Arrowheads in (e) highlight the AVG vestibular and acoustic regions. (k) The schematic drawing shows the experimental design. (l) AVG and OV areas were quantified (as described in the Materials and Methods section) and referred to the total area to compare the AVG size under the different culture conditions. The results were normalized to the 0S condition, which was given an arbitrary value of 100. The bars show the mean±S.E.M. of at least five otic vesicles from any of the conditions shown. Statistical significance was estimated with the Student's t-test: **P<0.01, and ***P<0.005 versus 0S and ###P<0.005 versus 3-MA. Bar=150 μm. (B) Double immunostaining of otic vesicles cultured under the above conditions was carried out for the transcription factor SOX2 (magenta), expressed in the proneural domain by otic precursors, and for the G4-glycoprotein used as a marker of neuronal processes (G4, green). Orientation: A, anterior; D, dorsal. Bar=150 μm. (C) AVG explants were obtained from stage HH19+ chicken embryos and cultured in the 0S condition or with 3-MA (10 mM) for 20 h. Whole AVG explants were immunostained for G4 (green) to observe the sensory otic neuron processes. Bar=300 μm. Fluorescence images were obtained from the compiled projections of confocal images of otic vesicles and acoustic-vestibular ganglia. Representative images of at least 5–6 samples per condition and from at least three independent experiments are shown

