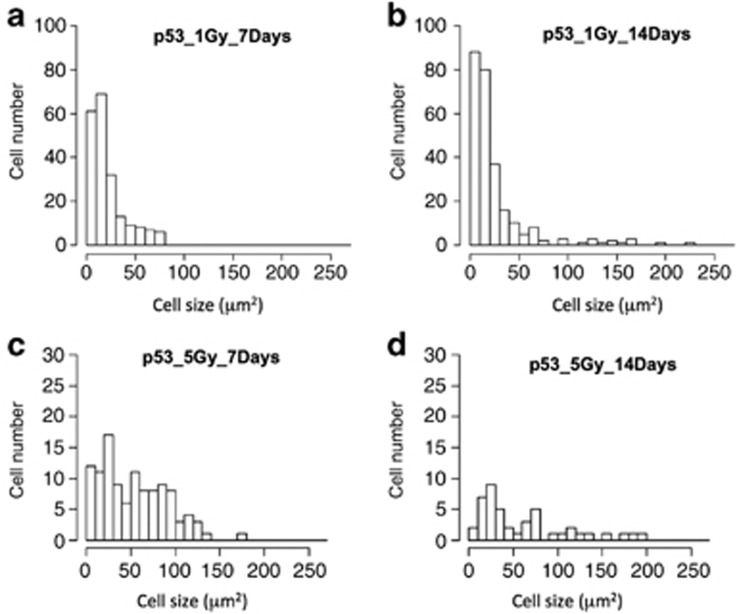
Figure 5.
Histograms of type A spermatogonia and testis–ova in p53(−/−) testes 7 days and 14 days after irradiation. Areas of type A spermatogonia and testis–ova were segmented and extracted from the pictures of p53(−/−) testes after 7 days and 14 days after irradiation with γ-rays (1 and 5 Gy) by image processing procedures based on mathematical morphology. As type A spermatogonia and testis–ova were not able to be identified definitely by their size, we prepared the histograms for the cells including both type A spermatogonia and testis–ova, calculated by the mathematical morphology-based image processing method. (a) p53(−/−) testes after 7 days with γ-ray 1 Gy, (b) p53(−/−) testes after 14 days with γ-ray 1 Gy, (c) p53(−/−) testes after 7 days with γ-ray 5 Gy and (d) p53(−/−) testes after 14 days with γ-ray 5 Gy

