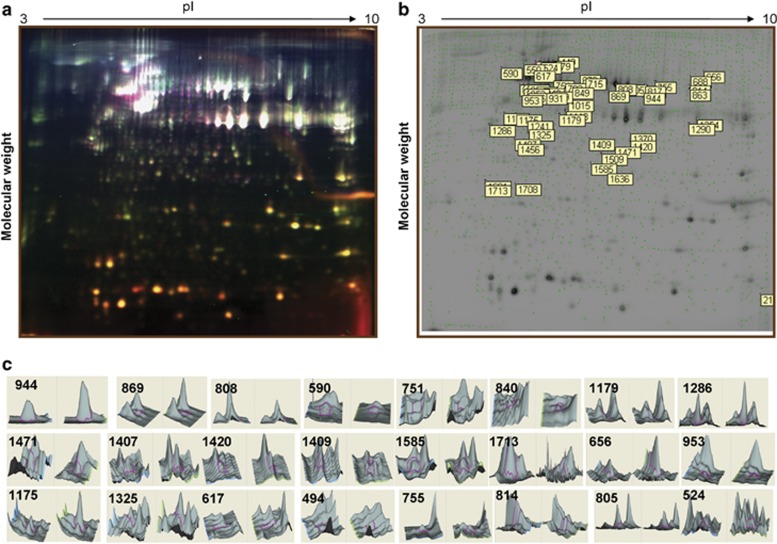
Figure 2.
Two-dimensional (2D) DIGE analysis of vehicle-treated control cells and DAMTC-treated NSCLC (A549) cells. (a) Representative 2D-DIGE image containing the Cy2, Cy3 and Cy5-labeled vehicle-treated control cells and DAMTC-treated protein lysates. (b) Master gel showing the differentially expressed spots between vehicle-treated control cells and DAMTC-treated NSCLC (A549) cells. The number in boxes represents the master spot number. (c) 3D view of all the differentially expressed proteins identified by 2D-DIGE analysis of NSCLC (A549) cells treated with DAMTC

