Figure 3.
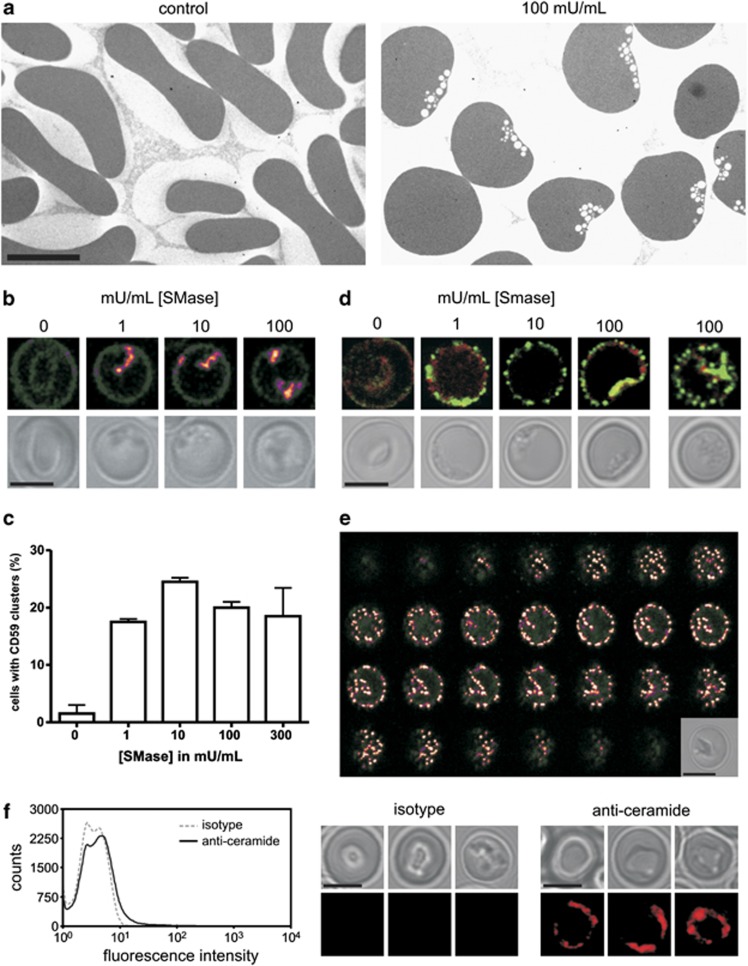
SMase-induced erythrocyte morphology, membrane lipid rafts, and intracellular invaginations. SMase treatment of erythrocytes was performed for 15 min at 37 °C. (a) Electron microscopy of control and SMase-treated erythrocytes as described in Materials and Methods. (b) Erythrocytes stained with an anti-CD59 antibody. (c) Quantification of CD59 cluster-positive erythrocytes. The graph presents mean values (N=2), error bars represent S.D. Two-hundred cells were scored by eye per experiment. (d) Acrolein-fixed erythrocytes stained with anti-stomatin (green) and anti-band 3 (red) antibodies. (e) Z-stack of an anti-stomatin-stained, tubulated, erythrocyte after treatment with 10 mU/ml SMase. A Z-slice spacing of 0.25 μM was used. (f) Flow cytometry and confocal microscopy of erythrocytes treated with 5 mU/ml SMase, stained with anti-ceramide or isotype control antibody. Confocal laser scanning microscopy was used to image fluorescence as described in Materials and Methods. Bright-field images are shown in combination with fluorescence images. Signal intensity in b and e: low=blue, intermediate=red, and high=yellow/white. Scale bar=5 μM. Representative images from one of two experiments are shown in all cases

