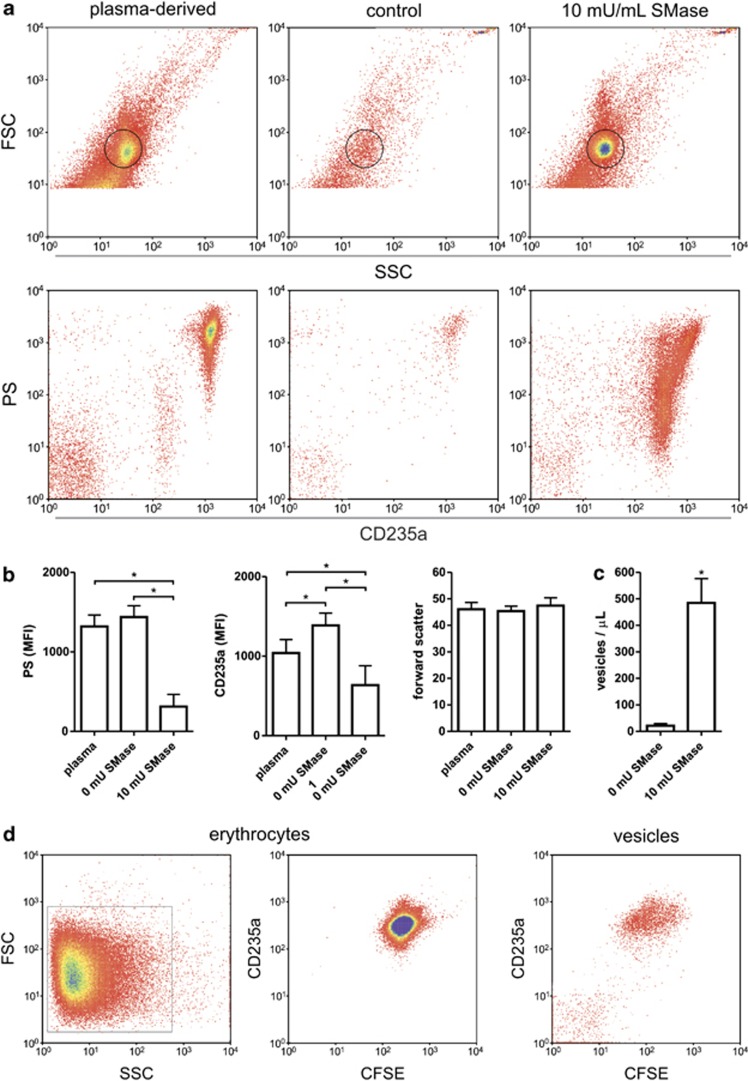
Figure 4.
SMase-induced vesiculation of erythrocytes. Erythrocytes were allowed to vesiculate in the presence or absence of 10 mU/ml SMase for 1 h at 37 °C. The vesicles were analyzed by flow cytometry. (a) Density plots of forward/sideward scatter (FSC and SSC, respectively), and Annexin V-FLUOS (PS)/anti-CD235a-PE staining of plasma-derived vesicles and vesicles generated in vitro. Vesicles were gated according to FSC/SSC for fluorescence analysis. (b) PS and CD235a mean fluorescence intensity (MFI), and forward scatter of plasma-derived and in vitro CD235a+ vesicles. (c) Quantification of CD235a+ vesicles after erythrocyte vesiculation in the absence or presence of SMase. Fluorescent 10 μM counting beads were used as an internal standard. (d) Bottom left and center: density plots of CFSE-loaded erythrocytes treated with SMase and stained with anti-CD235a-PE. The vesicles generated during the treatment of these cells were stained with anti-CD235a-PE and Annexin V-Alexa 647. Bottom right: vesicles that were within the standard FSC/SSC vesicle range and that were positive for Annexin V are shown in the CFSE/CD235a density plot. For the assessment of dimensions, only PS+CD235a+ vesicles were considered. Data from five healthy volunteers are presented. The graphs present mean values, error bars represent S.D., and *P<0.05

